Figures
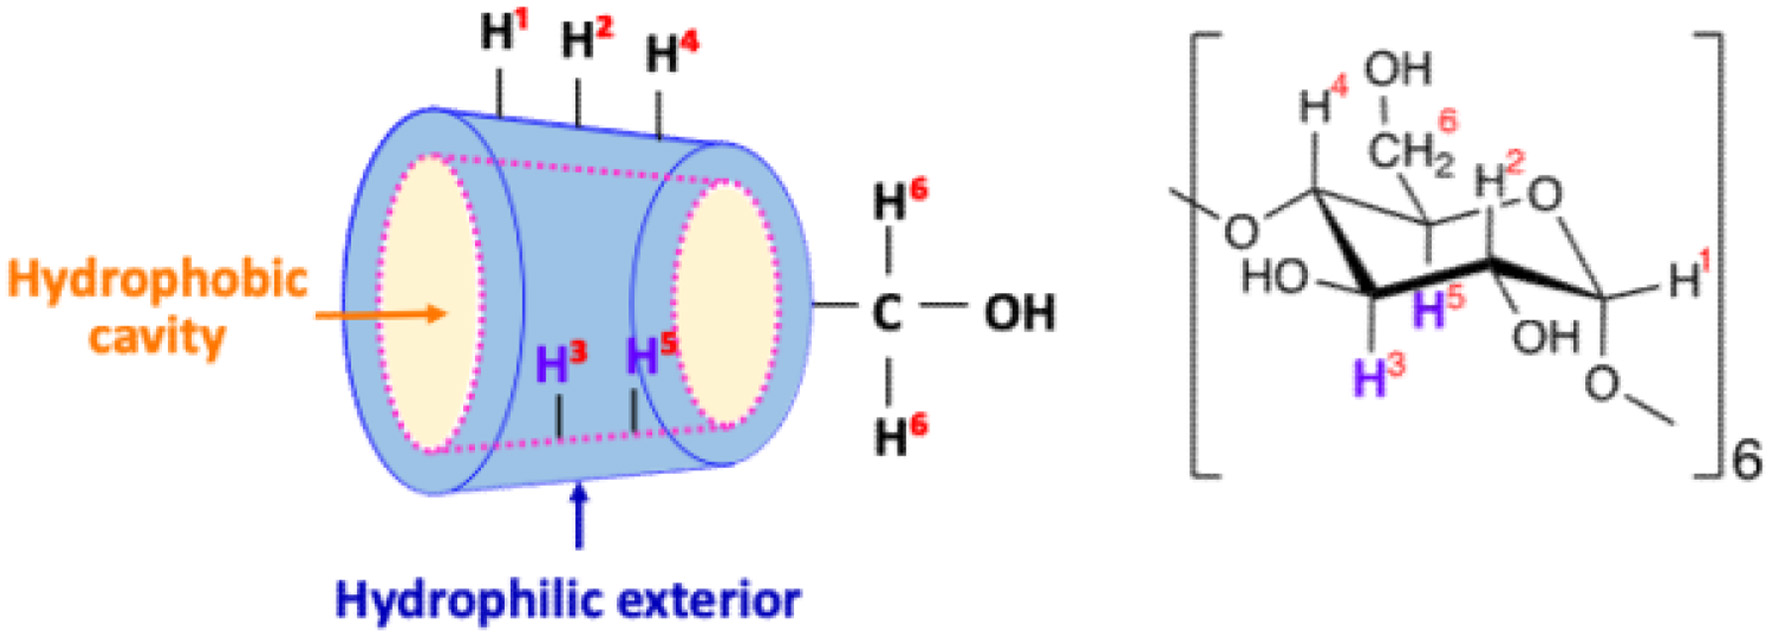
Figure 1. Schematic diagram of α-CD structure.
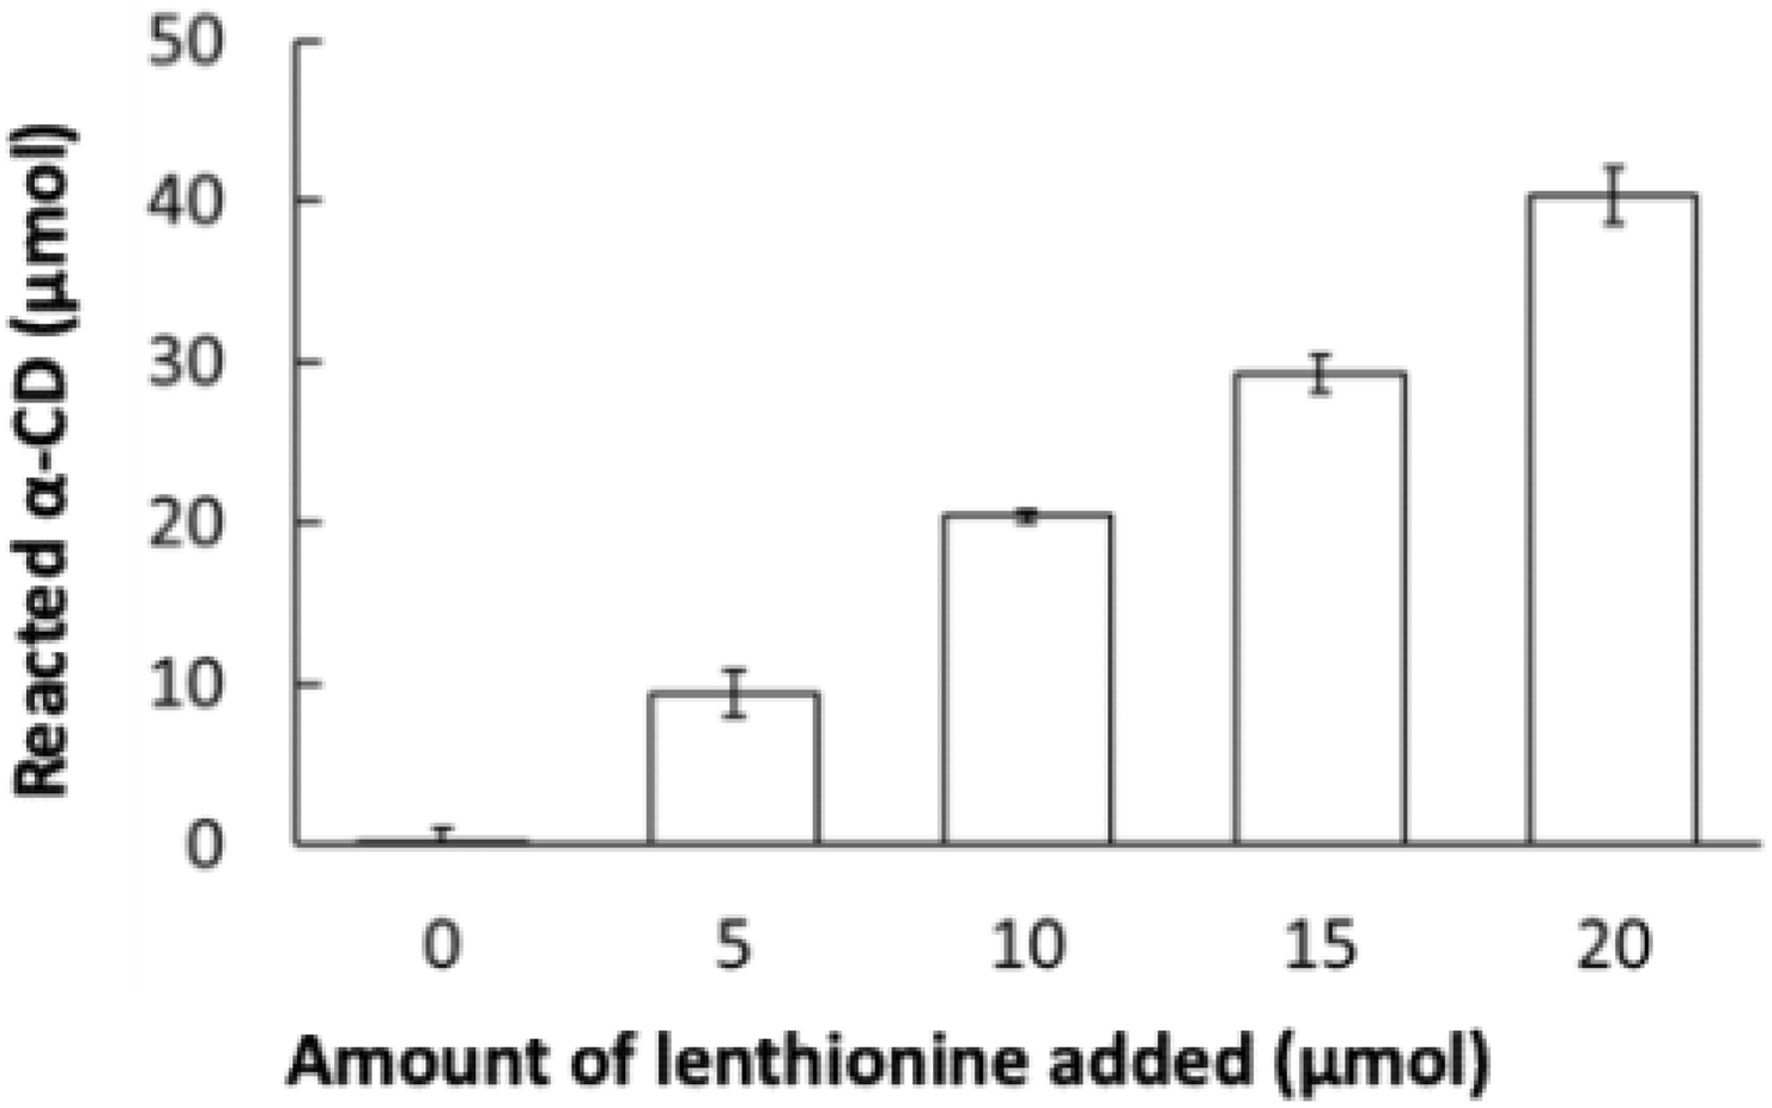
Figure 2. Reaction of lenthionine with α-CD. Values are means ± SE of 3 different experiments.
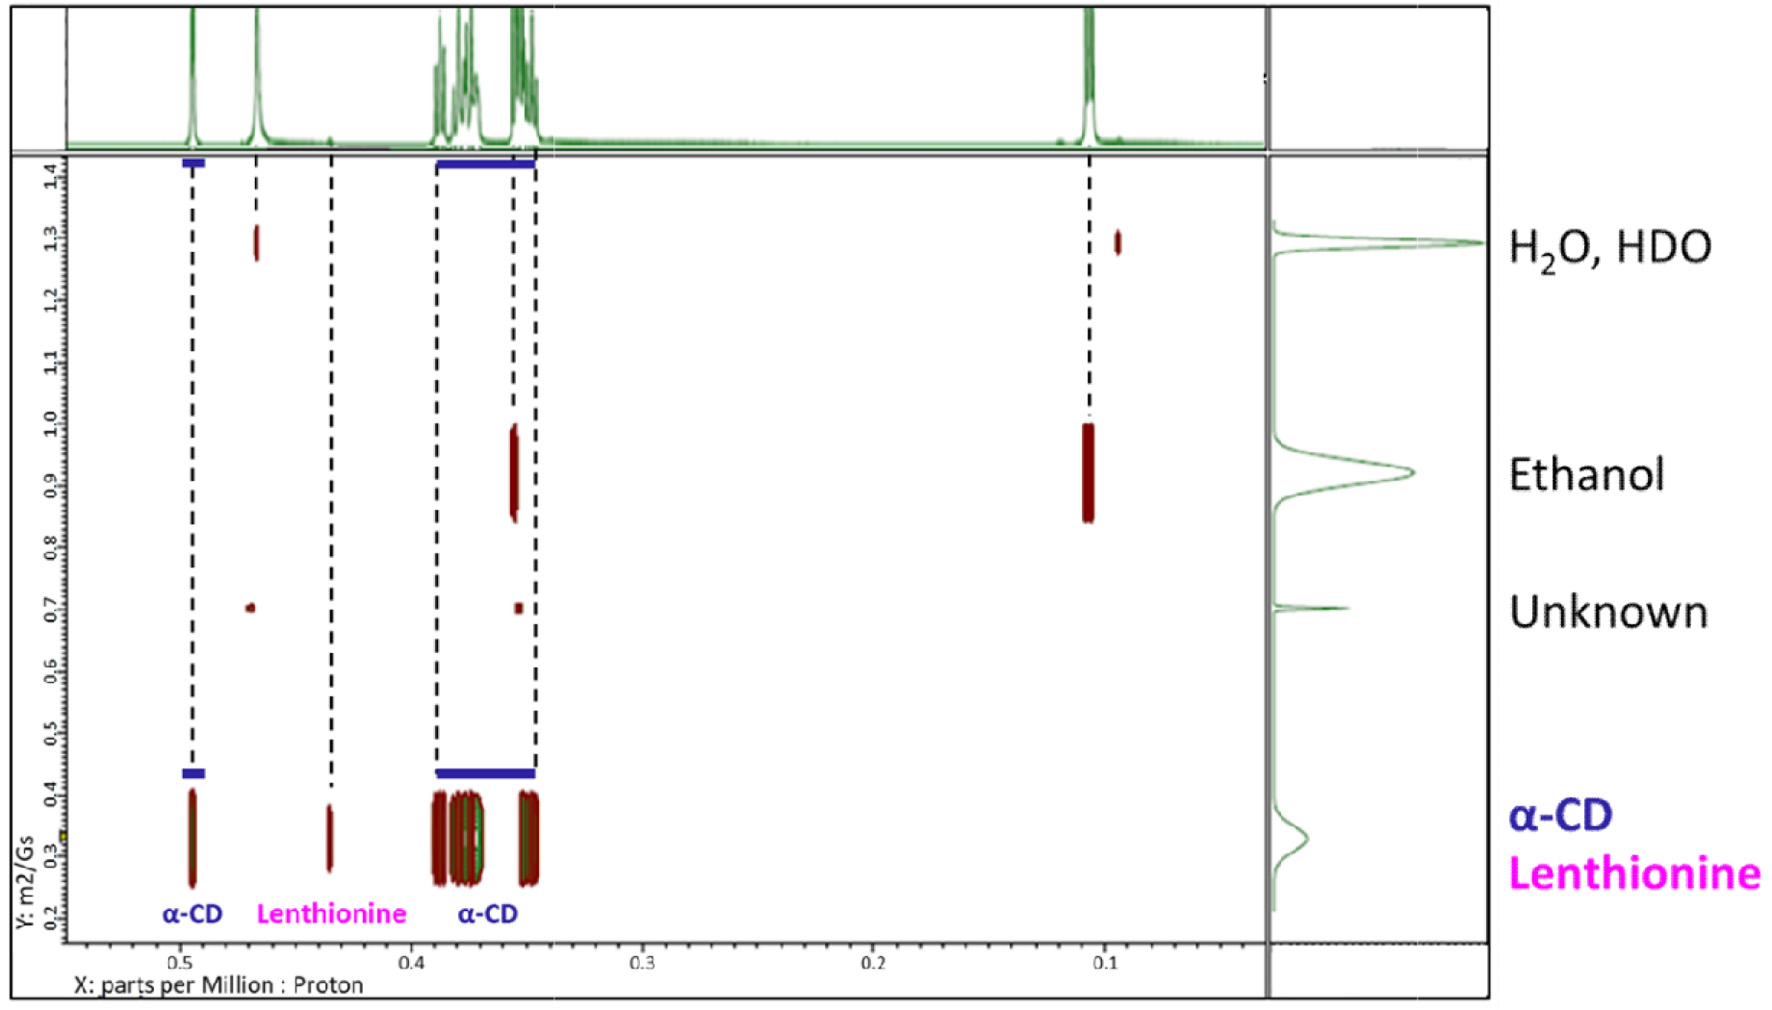
Figure 3. DOSY-NMR spectra of the lenthionine/α-CD inclusion complex.
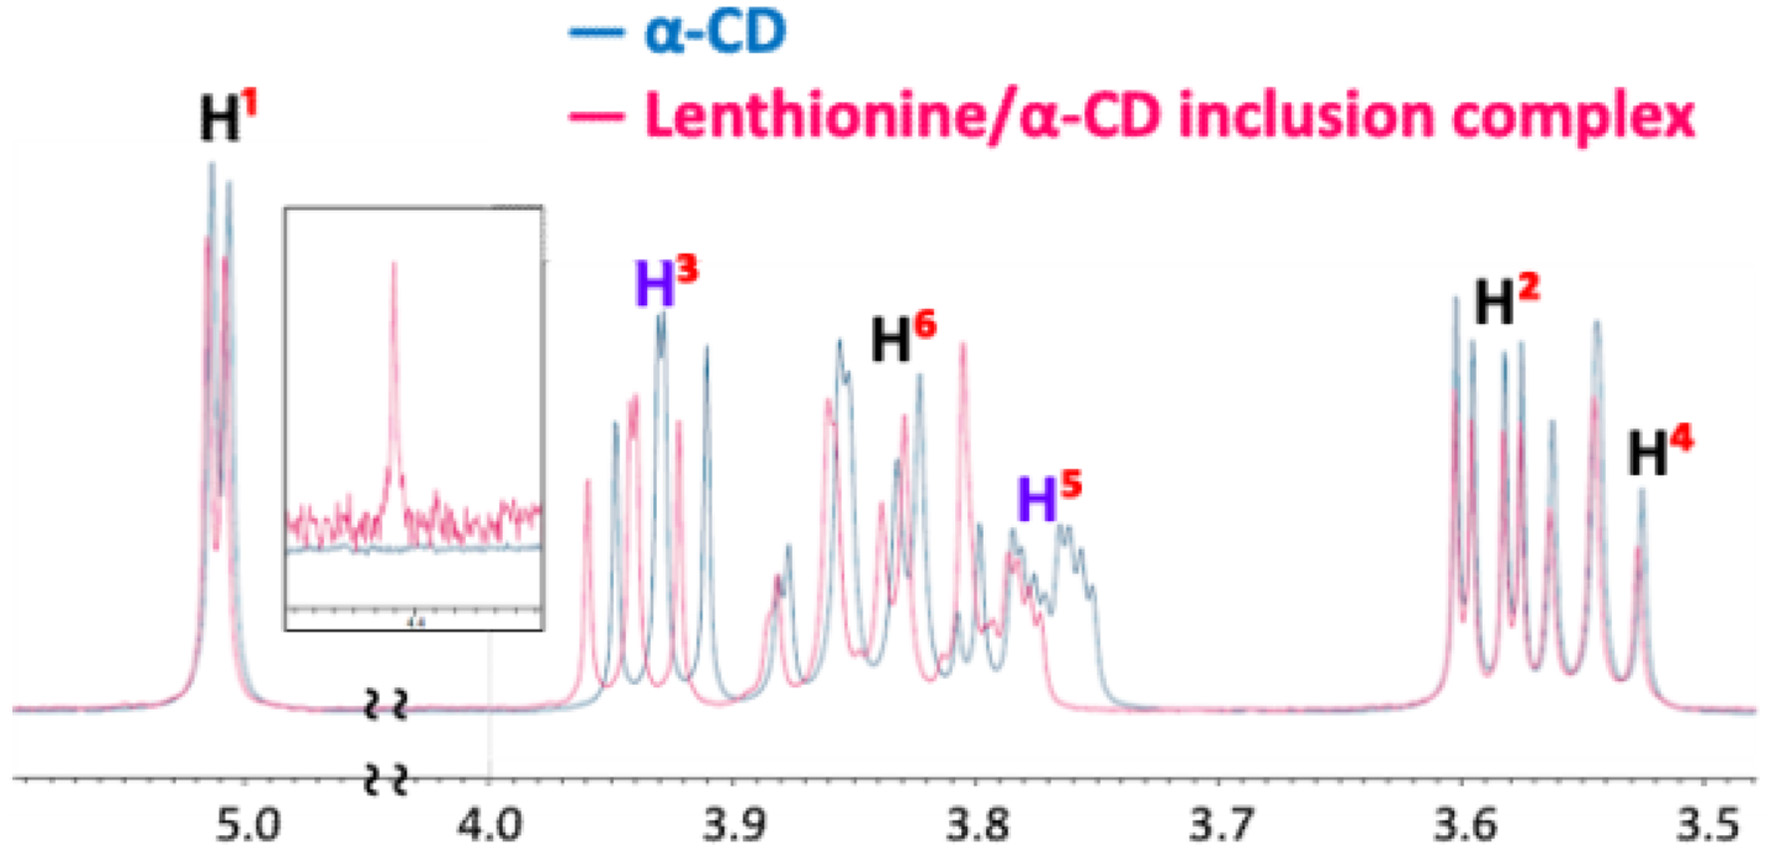
Figure 4. 1H NMR spectral data of α-CD and the lenthionine/α-CD inclusion complex.
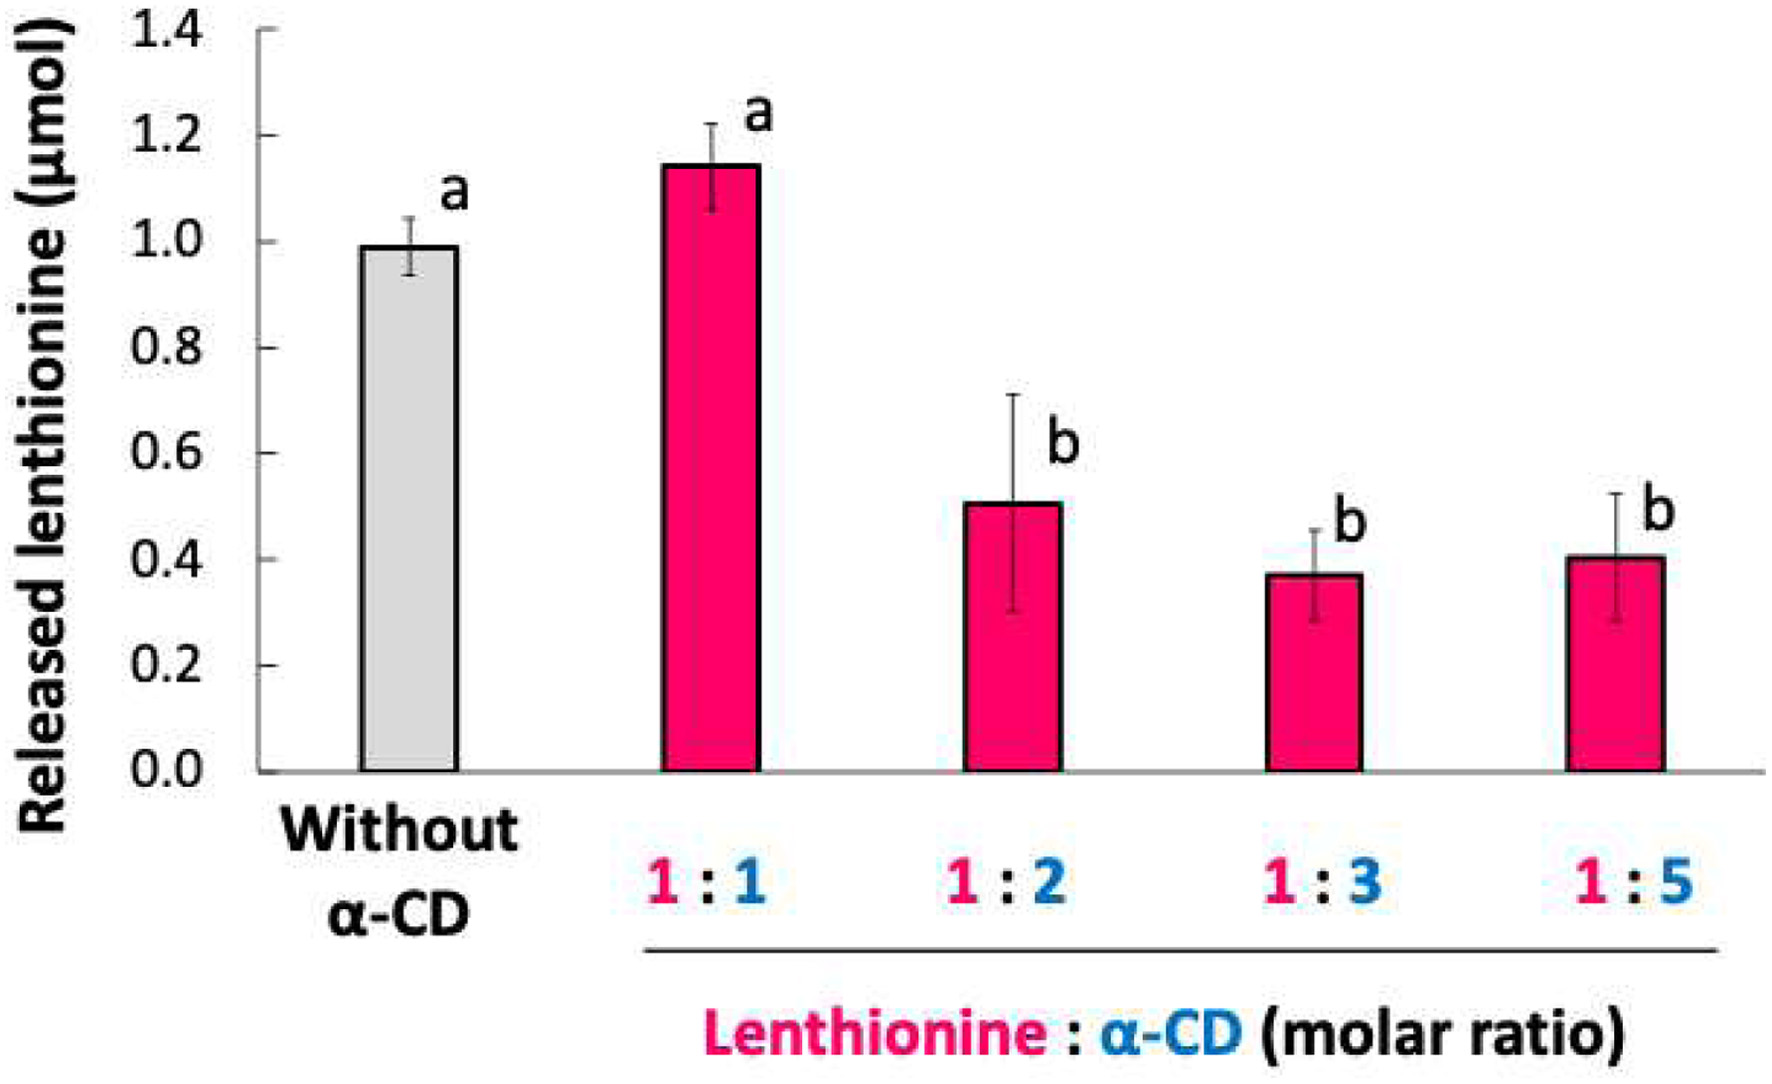
Figure 5. Amount of lenthionine released from the inclusion complex with α-CD. Values are presented as means ± SE of 3 different experiments. Bars with different letters indicate significant differeneces at p < 0.01 according to Tukey-Kramer test.
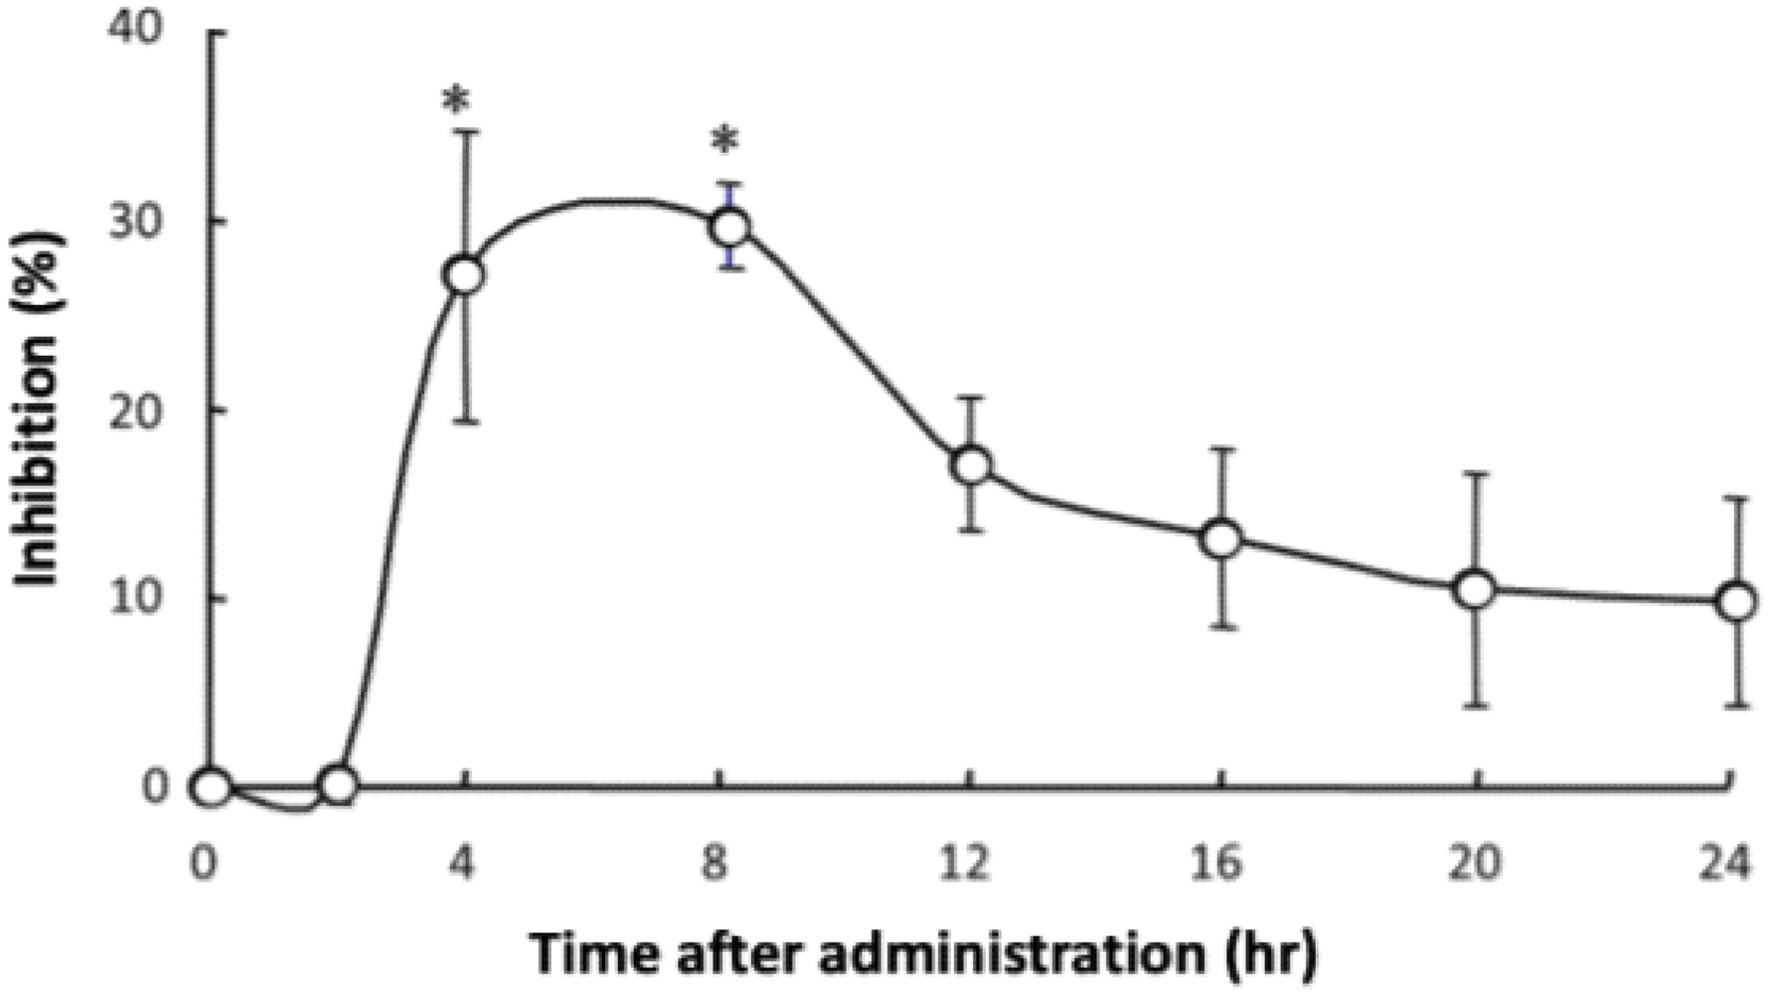
Figure 6. Time-dependent changes in the inhibitory effect of the lenthionine/α-CD inclusion complex on platelet aggregation after oral administration. Values are presented as means ± SE of 5 different experiments. * represents a significant difference from the 0-h group at p < 0.01.
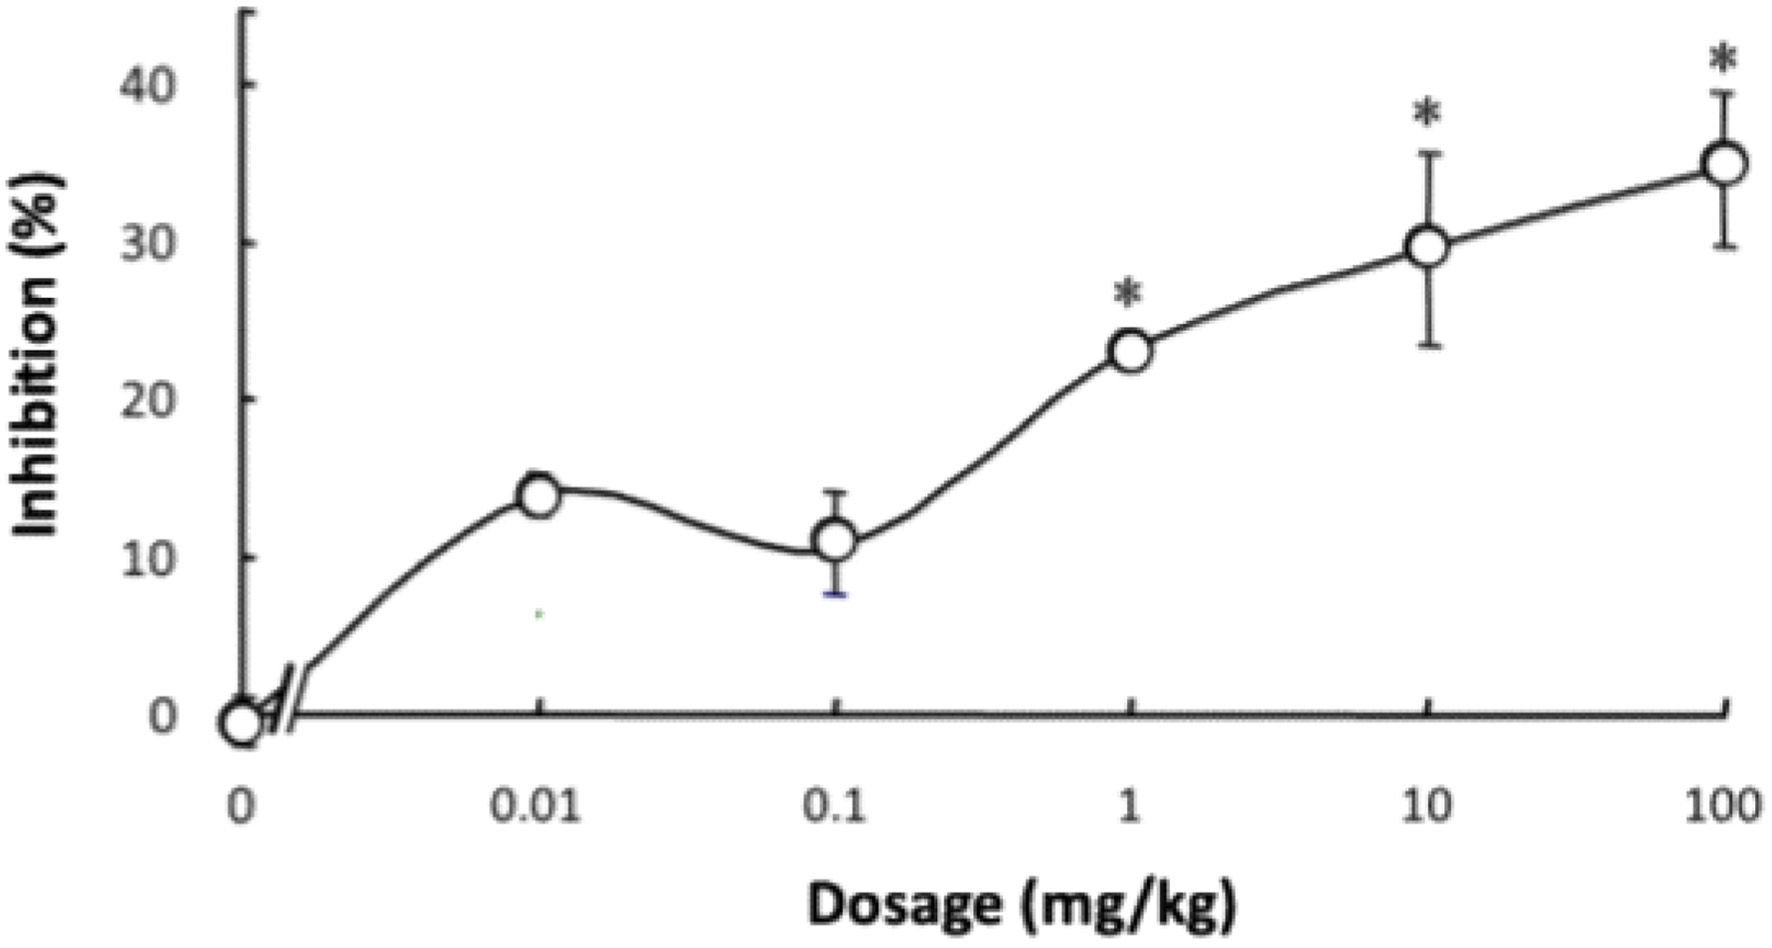
Figure 7. Dose-dependent changes in the inhibitory effect of the lenthionine/α-CD inclusion complex on platelet aggregation after oral administration. Values are presented as means ± SE of 5 different experiments. * represents a significant difference from the 0-mg/kg group at p < 0.01.
Table
Table 1. Chemical shifts (δ) of α-CD and the lenthionine/α-CD inclusion complex
| Chemical shift δ (ppm) |
|---|
| H1 | H2 | H3 | H4 | H5 | H6 |
|---|
| α-CD | 5.010 | 3.579 | 3.929 | 3.535 | 3.763 | 3.854 |
| Lenthionine/α-CD inclusion complex | 5.012 | 3.580 | 3.941 | 3.536 | 3.785 | 3.859 |
| Δδ | 0.002 | 0.001 | 0.012 | 0.001 | 0.022 | 0.005 |


