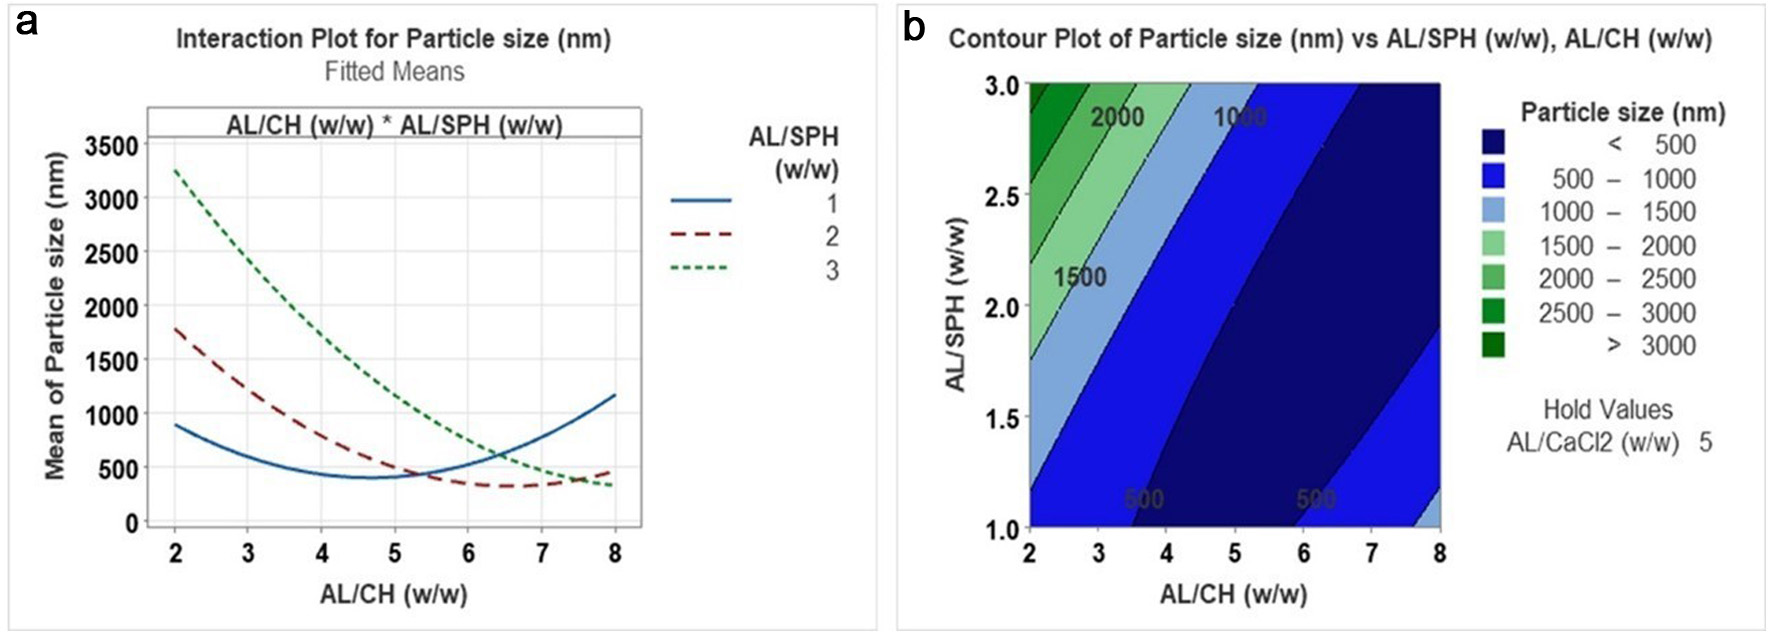
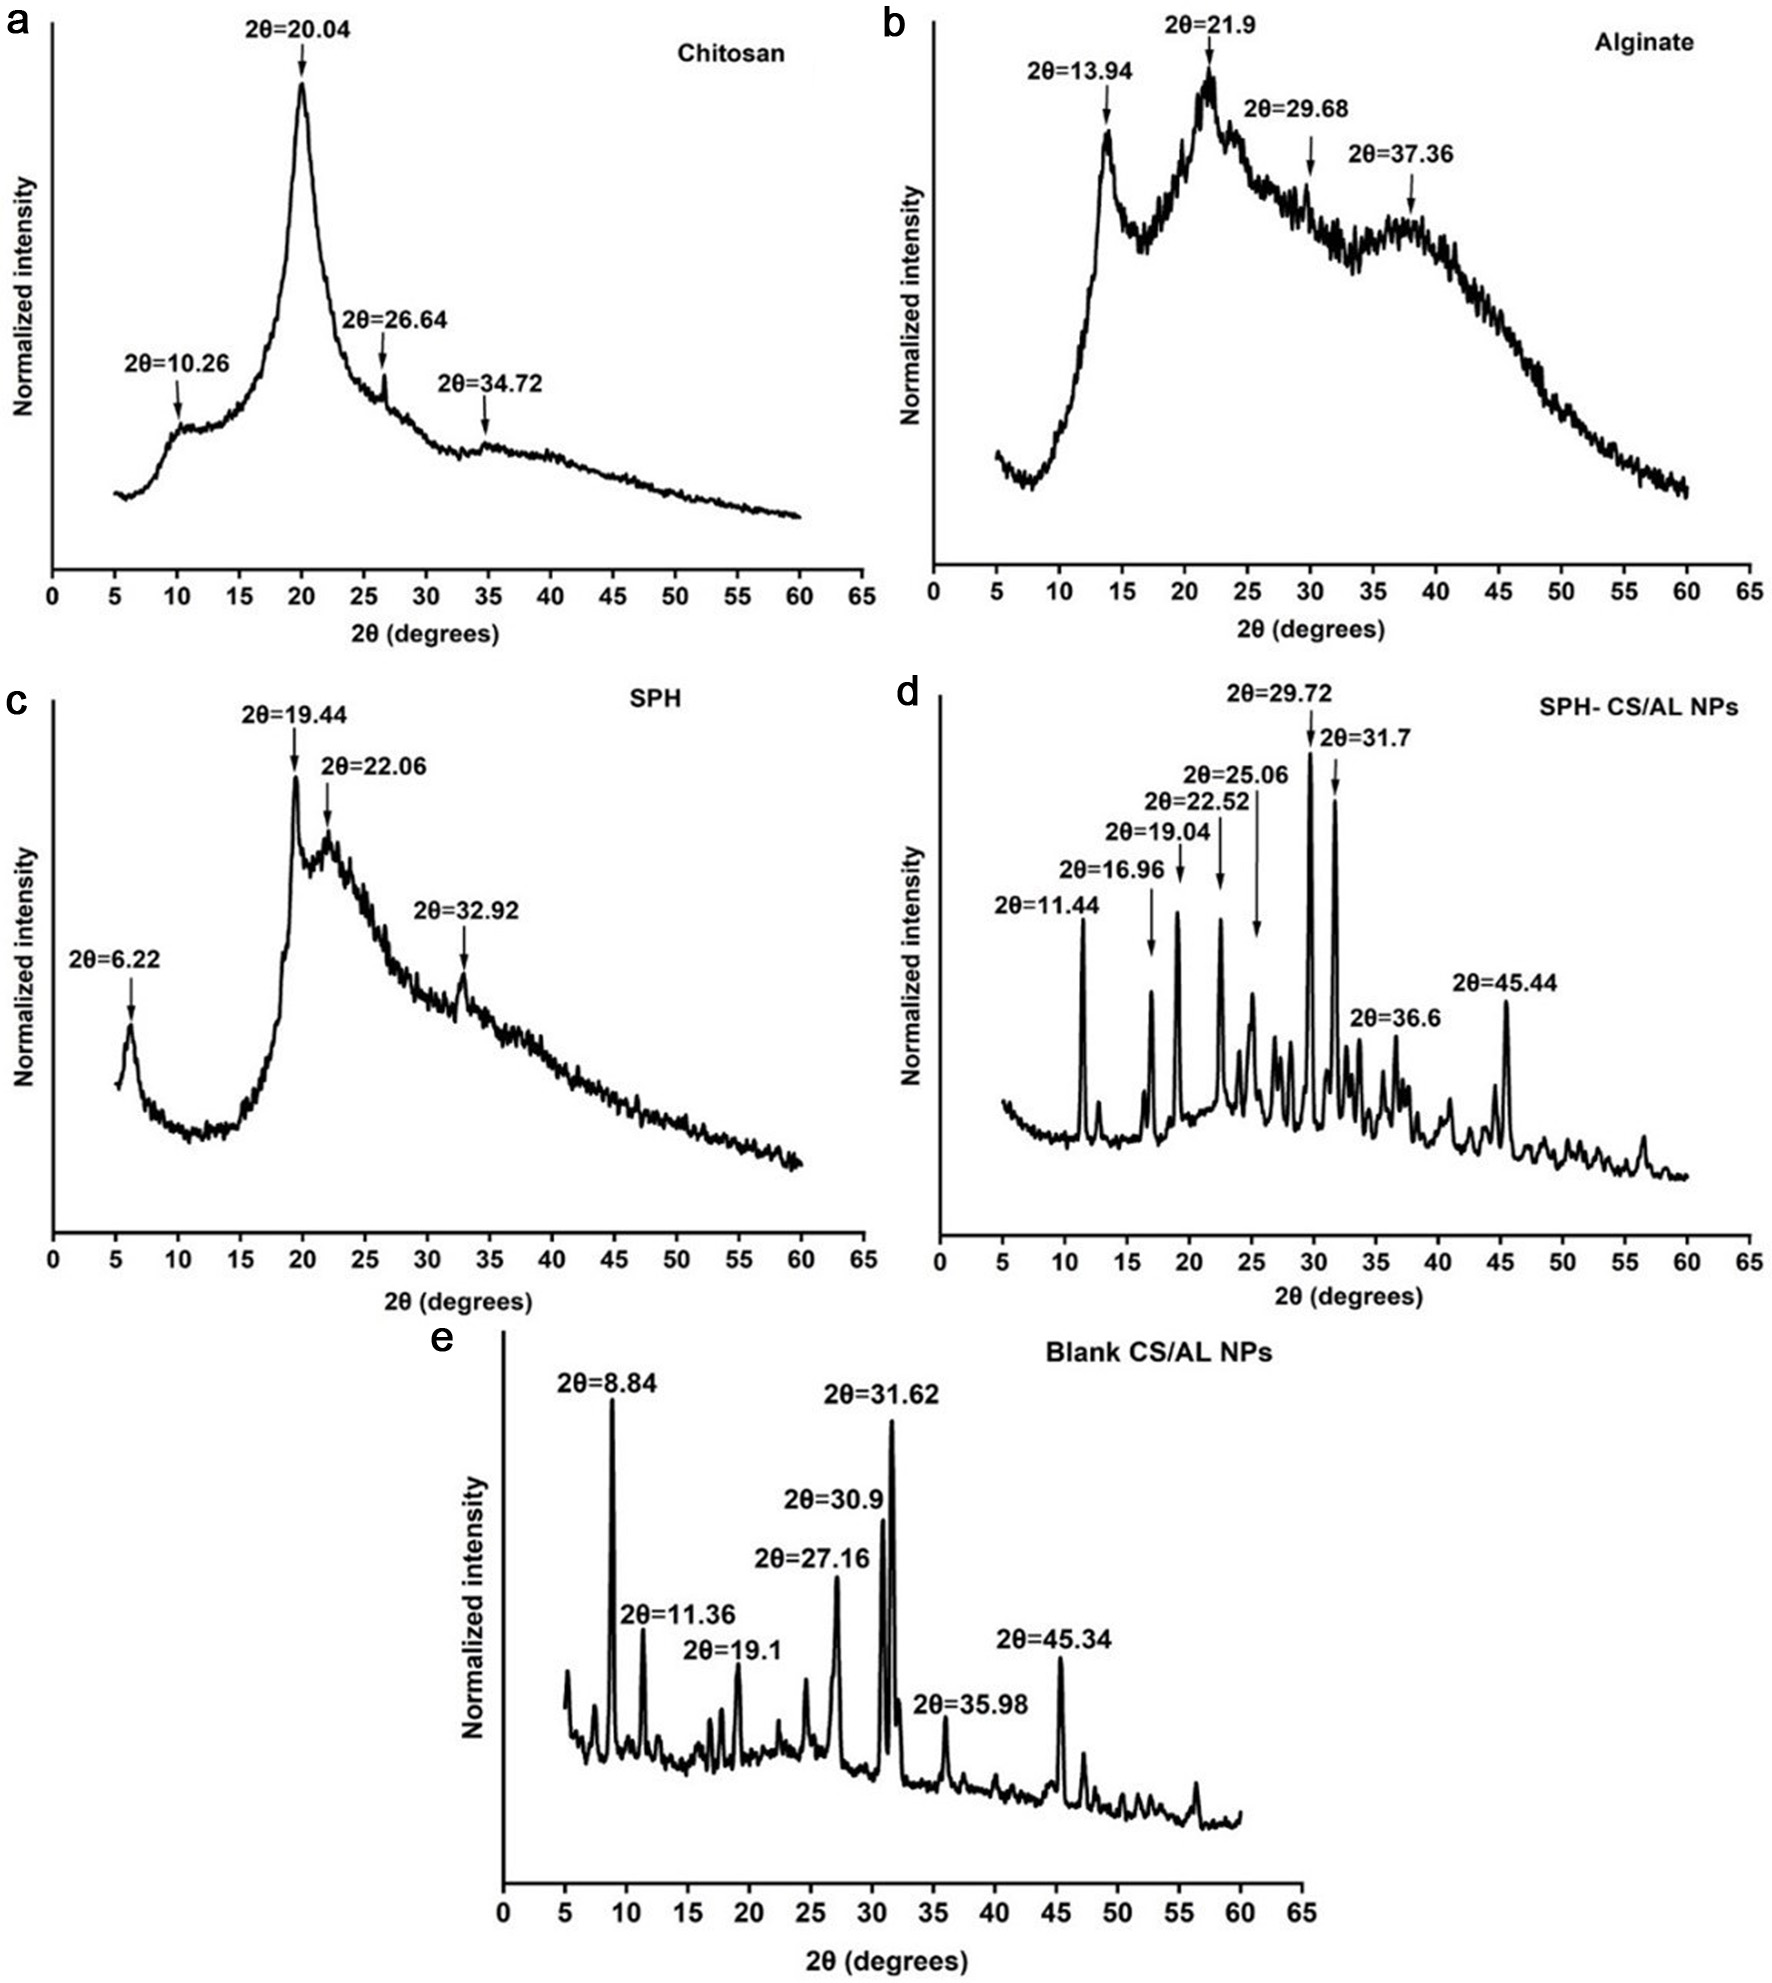
Figure 1. Interaction plot (a) and contour plot (b) for the effect of AL/CH (alginate/chitosan) (w/w) versus AL/SPH (alginate/ S. salar by-product-derived protein hydrolysates) (w/w) on particle size.
| Journal of Food Bioactives, ISSN 2637-8752 print, 2637-8779 online |
| Journal website www.isnff-jfb.com |
Original Research
Volume 27, September 2024, pages 58-69
Encapsulating Salmo salar byproduct-derived protein hydrolysate in chitosan/alginate nanoparticles
Figures
Tables
| Codes | Independent variables | Levels | ||
|---|---|---|---|---|
| Low (−1) | Medium (0) | High (+1) | ||
| X1 | Alginate/Chitosan (w/w) (AL/CH) | 2 | 5 | 8 |
| X2 | Alginate/CaCl2 (w/w) (AL/CaCl2) | 4 | 5 | 6 |
| X3 | Alginate/peptides (w/w) (AL/SPH) | 1 | 2 | 3 |
| Saliva stock solution | Gastric stock solution | Duodenal stock solution | Bile stock solution |
|---|---|---|---|
| 200 mL of milliQ water | 200 mL of milliQ water | 200 mL of milliQ water | 250 mL of milliQ water |
| 23.4 mg NaCl | 1.10 g NaCl | 2.80 g NaCl | 2.10 g NaCl |
| 29.8 mg KCl | 0.33 g KCl | 0.23 g KCl | 0.15 g KCl |
| 0.42 g NaHCO3 | 0.11 g NaHPO4 | 1.36 g NaHCO3 | 2.31 g NaHCO3 |
| 0.08 g of Urea | 0.16 g CaCl2·2H2O | 32 mg KH2PO4 | 0.10 g Urea |
| 0.12 g NH4Cl | 20 mg MgCl2 | 0.06 mL Conc. HCl | |
| 0.03 g Urea | 0.04 g Urea | ||
| 2.6 mL Conc. HCl | 0.0 mL Conc. HCl | ||
| 0.4 g Amylase | 1 g Pepsin | 3.6 g Pancreatin | 12 g Bile extract |
| pH 6.8 ± 0.2 | pH 1.3 ± 0.02 | pH 8.1 ± 0.2 | pH 8.2 ± 0.2 |
| Response | Significance | R2 | Adjusted R2 | Predicted R2 |
|---|---|---|---|---|
| Particle size | 0.000 | 0.8301 | 0.7979 | 0.7267 |
| Zeta potential | 0.000 | 0.7807 | 0.7526 | 0.6925 |
| Encapsulation efficiency (EE) | 0.000 | 0.8981 | 0.8718 | 0.8205 |
| Response variable | Predicted value | Experimented value | 95% Confidence Interval |
|---|---|---|---|
| Particle size (nm) | 417 | 536.70 ± 21.20 | (87, 748) |
| Zeta potential (mV) | −32.4 | −30.22 ± 0.88 | (−36.621, −28.179) |
| EE (%) | 29.63 | 29.80 ± 4.5 | (19.49, 39.78) |