Figures
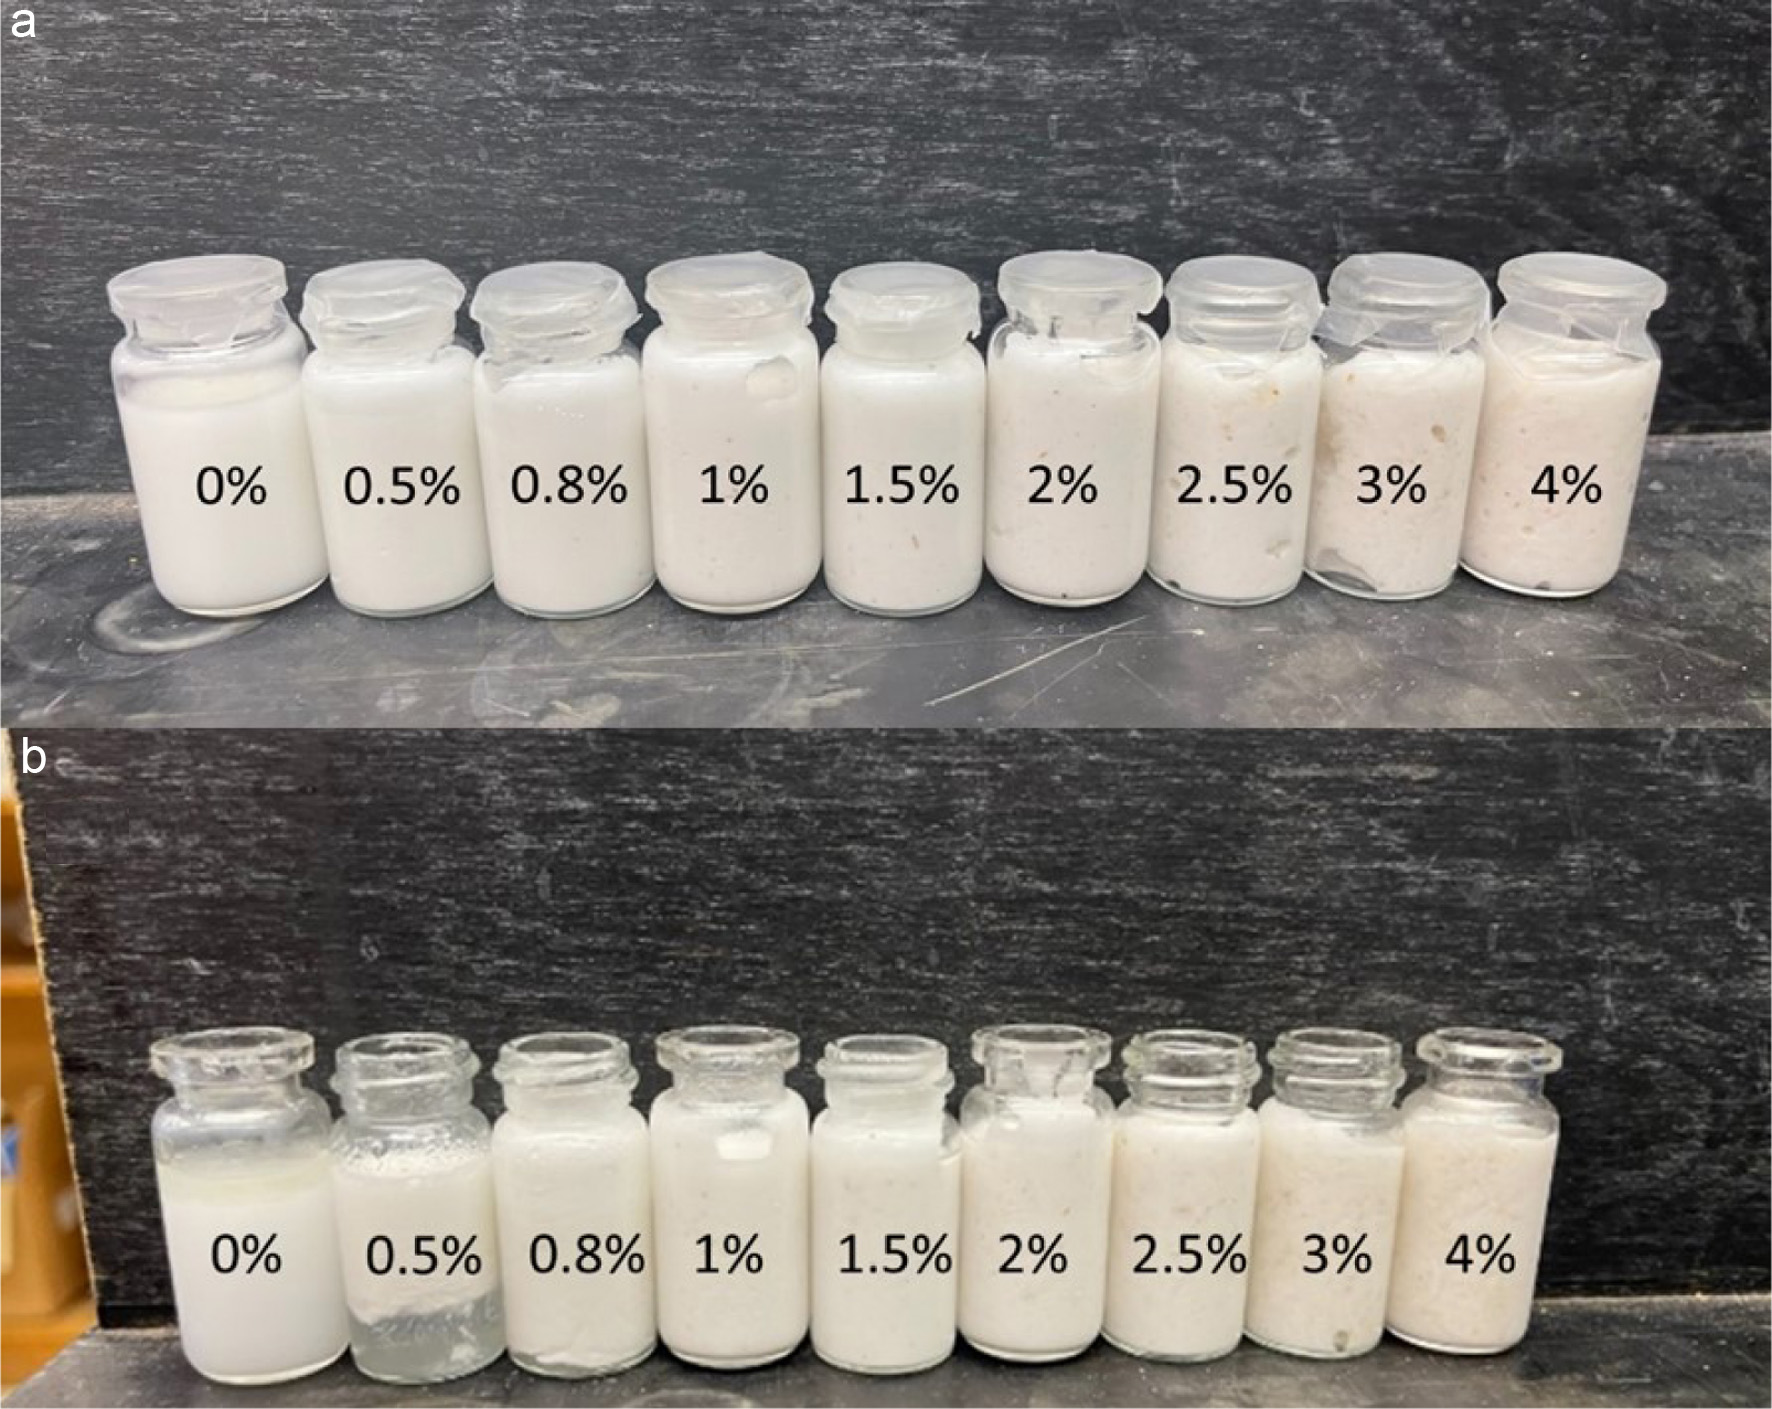
Figure 1. (a) Primary emulsions with 0%, 0.5%, 0.8%, 1%, 1.5%, 2%, 2.5%, 3% and 3.5% psyllium husk in sunflower oil. (b) Primary emulsions in Figure 1.A after 3 weeks storage in 4 °C refrigerator.
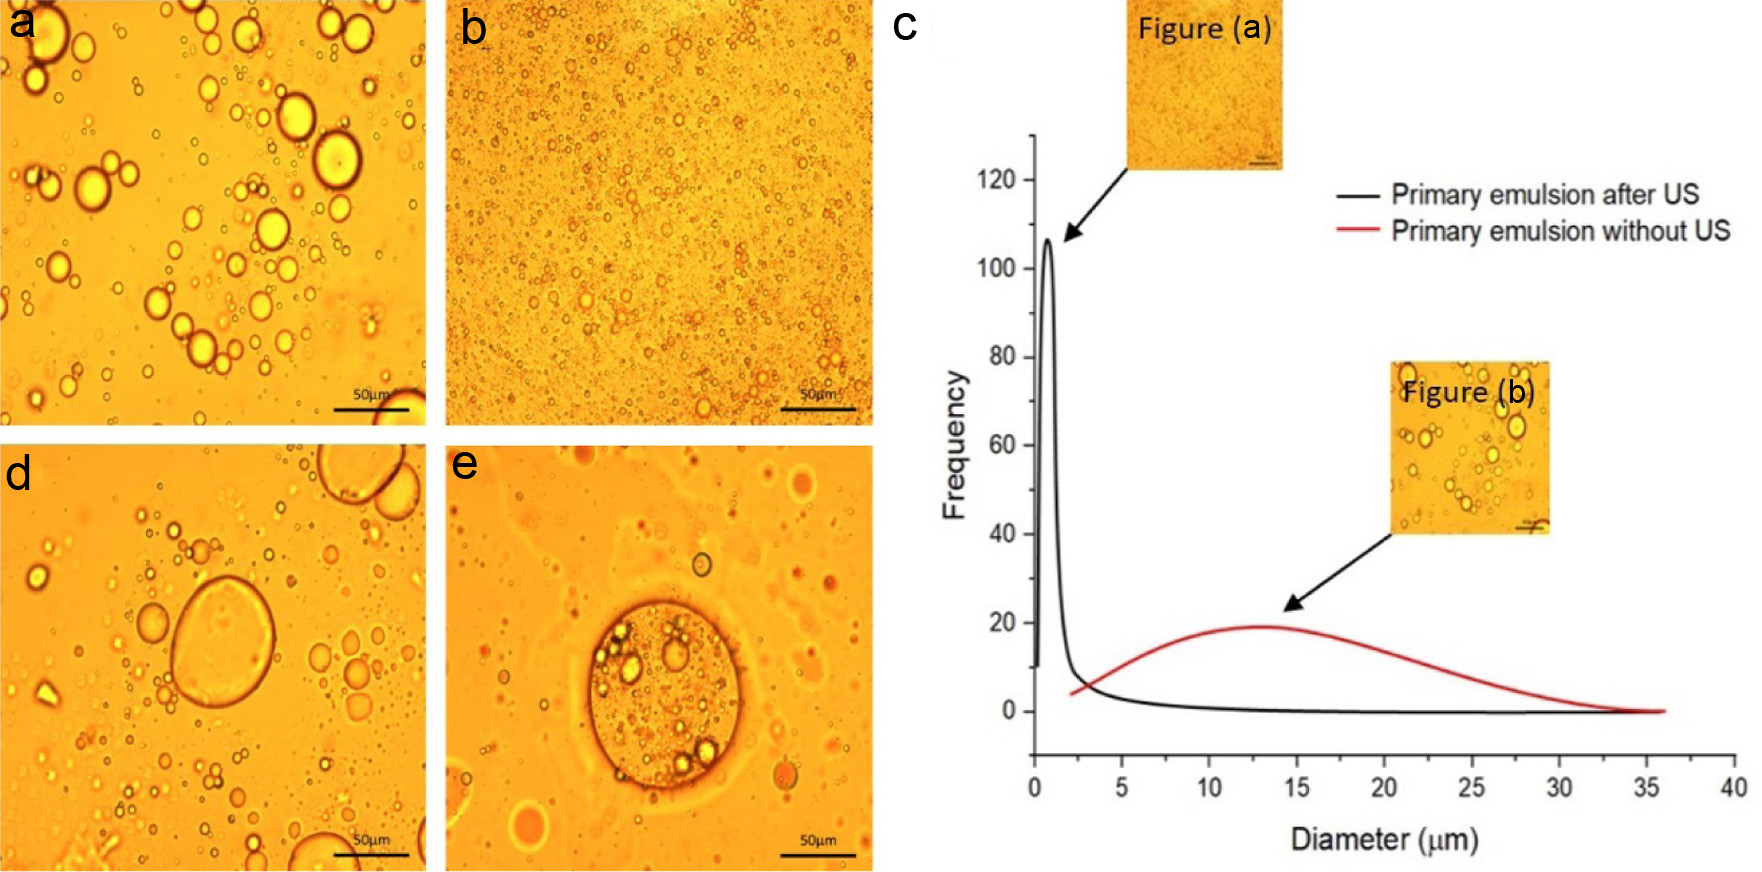
Figure 2. Optical microscope images of emulsions. (a) Primary emulsion without ultrasound treatment. (b) Primary emulsion with ultrasound treatment. (c) Particle size analysis of primary emulsions. (d) Double emulsion without ultrasound treatment. (e) Double emulsion with ultrasound treatment.
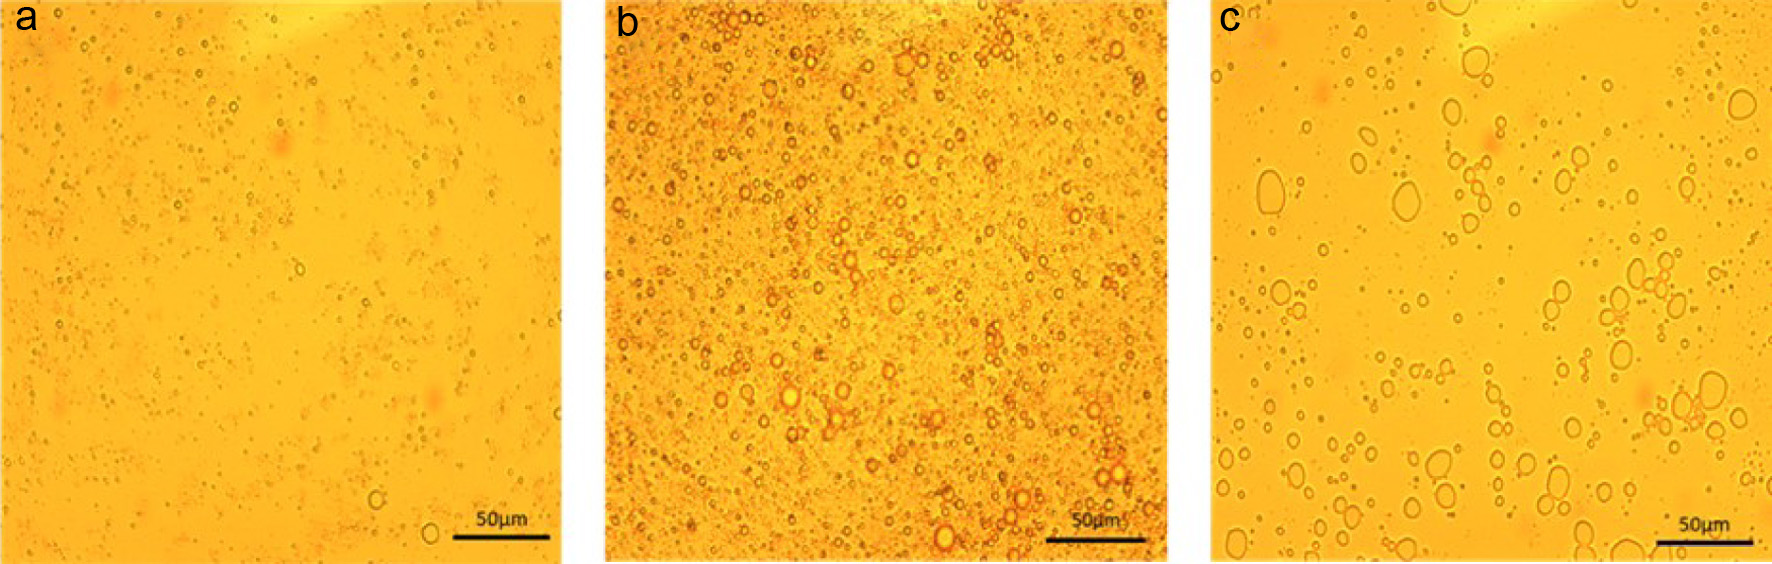
Figure 3. Microscopic observation (500×) of primary emulsion with different loaded oil content after ultrasound treatment. (a) 5% oil in primary emulsion (b) 10% oil in primary emulsion (c) 20% oil in primary emulsion. Dark line indicates length of 50µm.
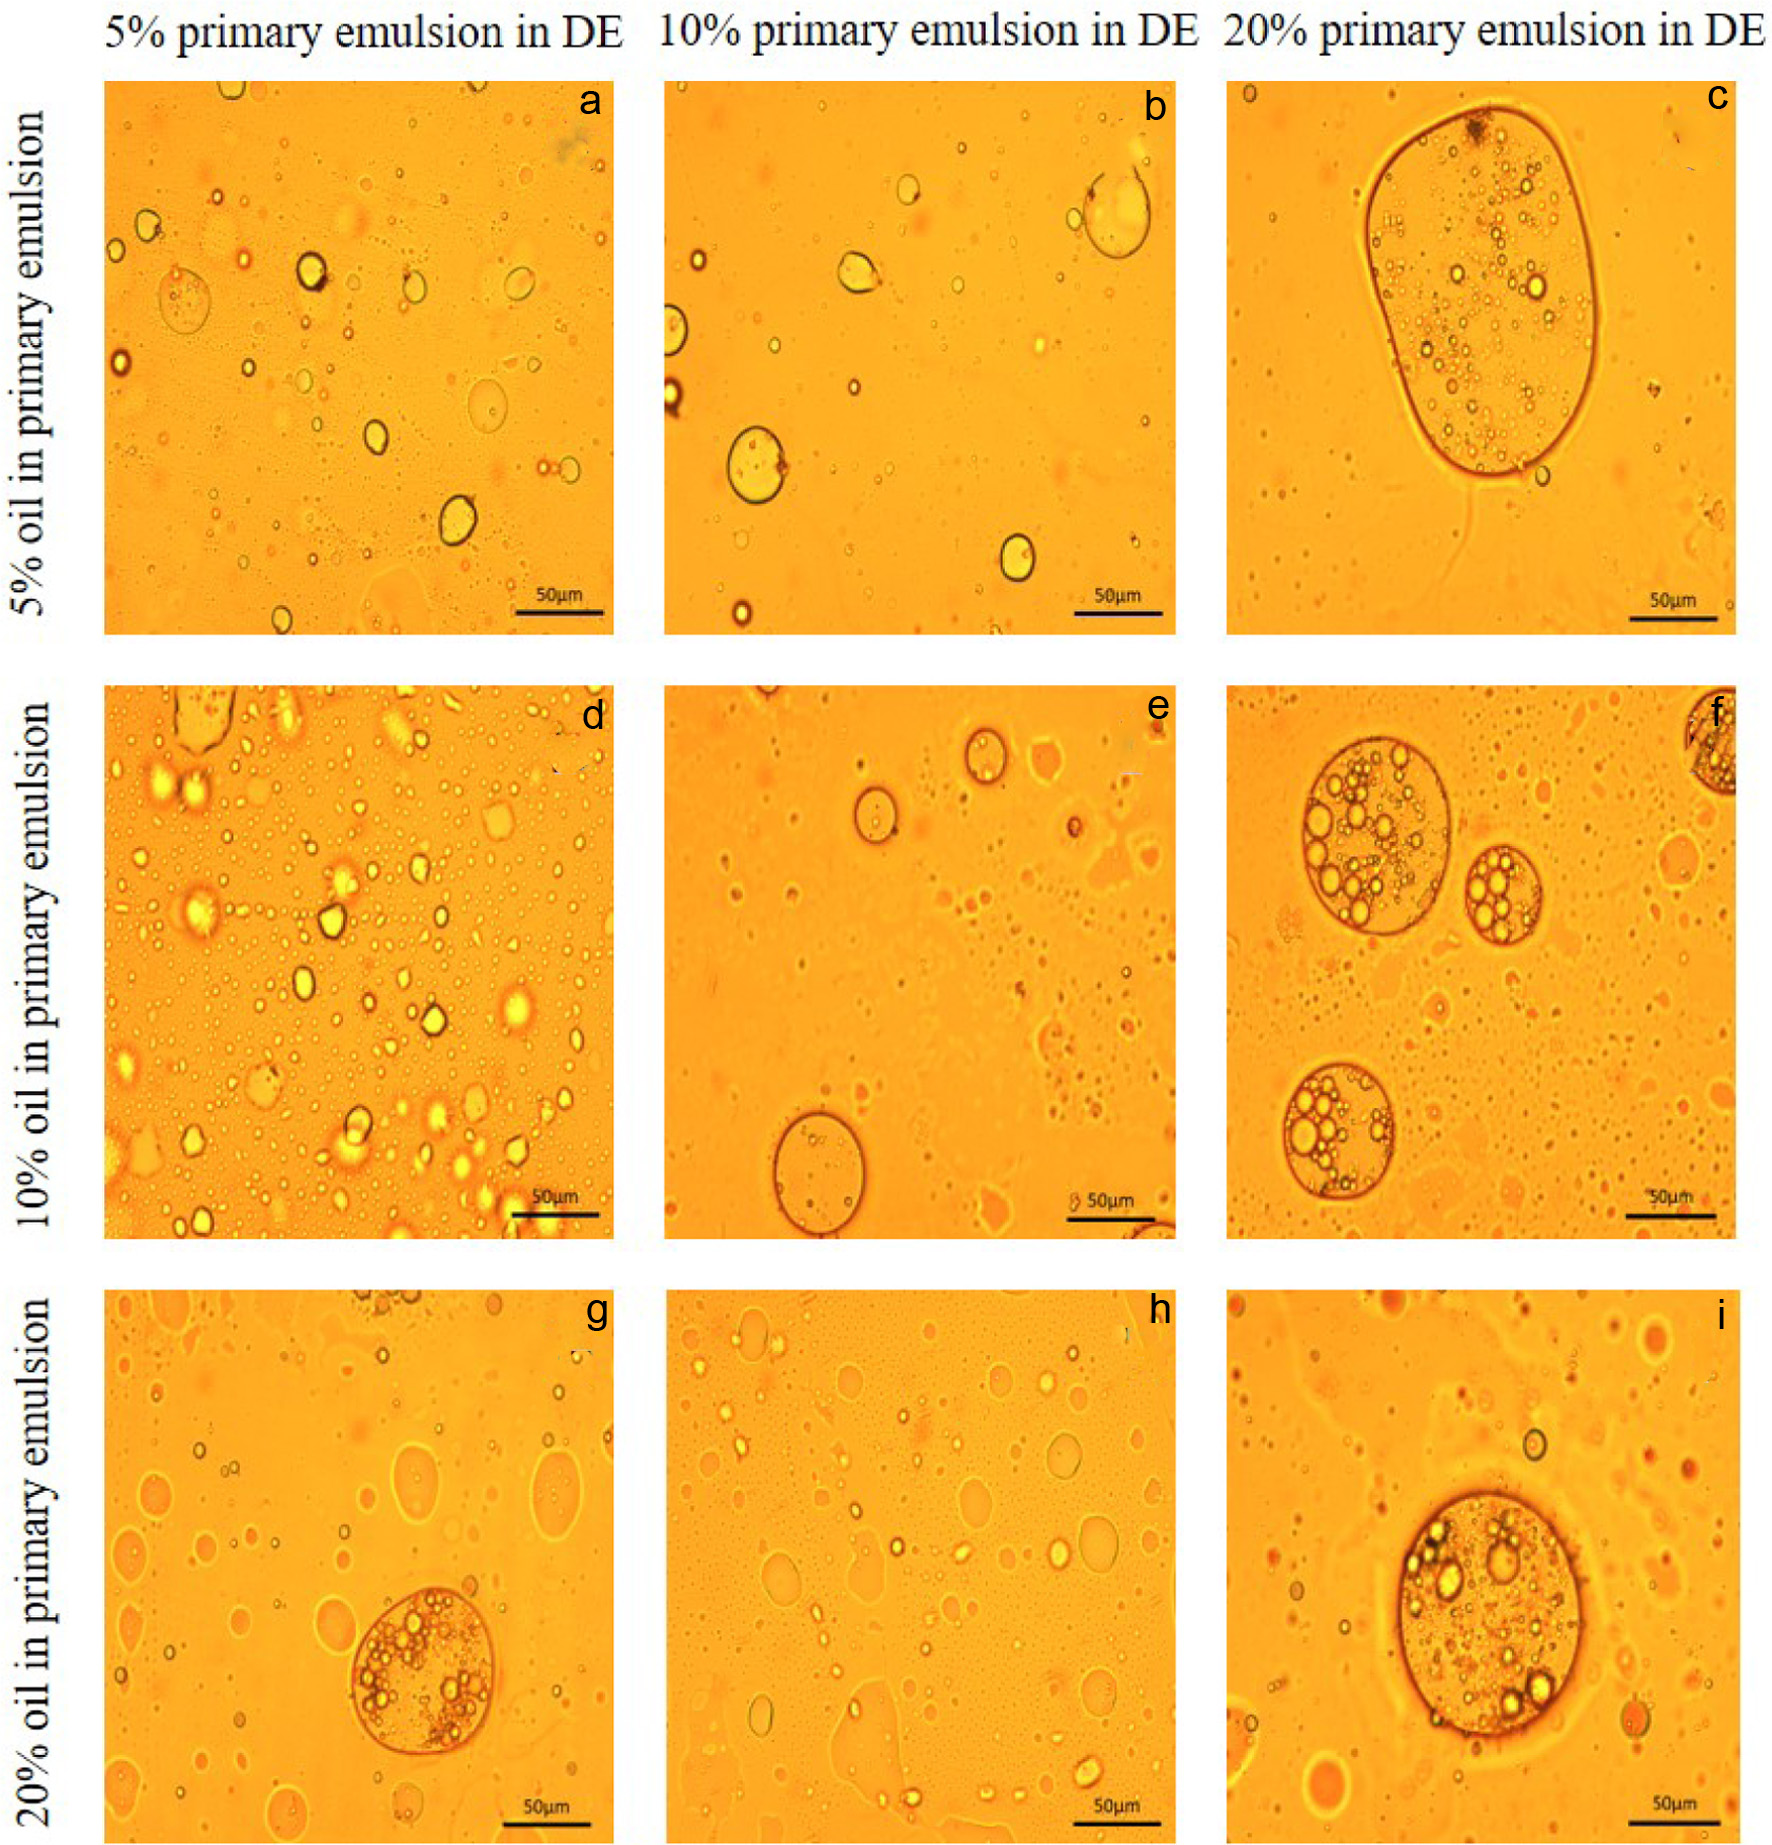
Figure 4. Microscopic observation (500×) of 9 different formulations double emulsion after ultrasound treatment. Dark line indicates length of 50 µm.
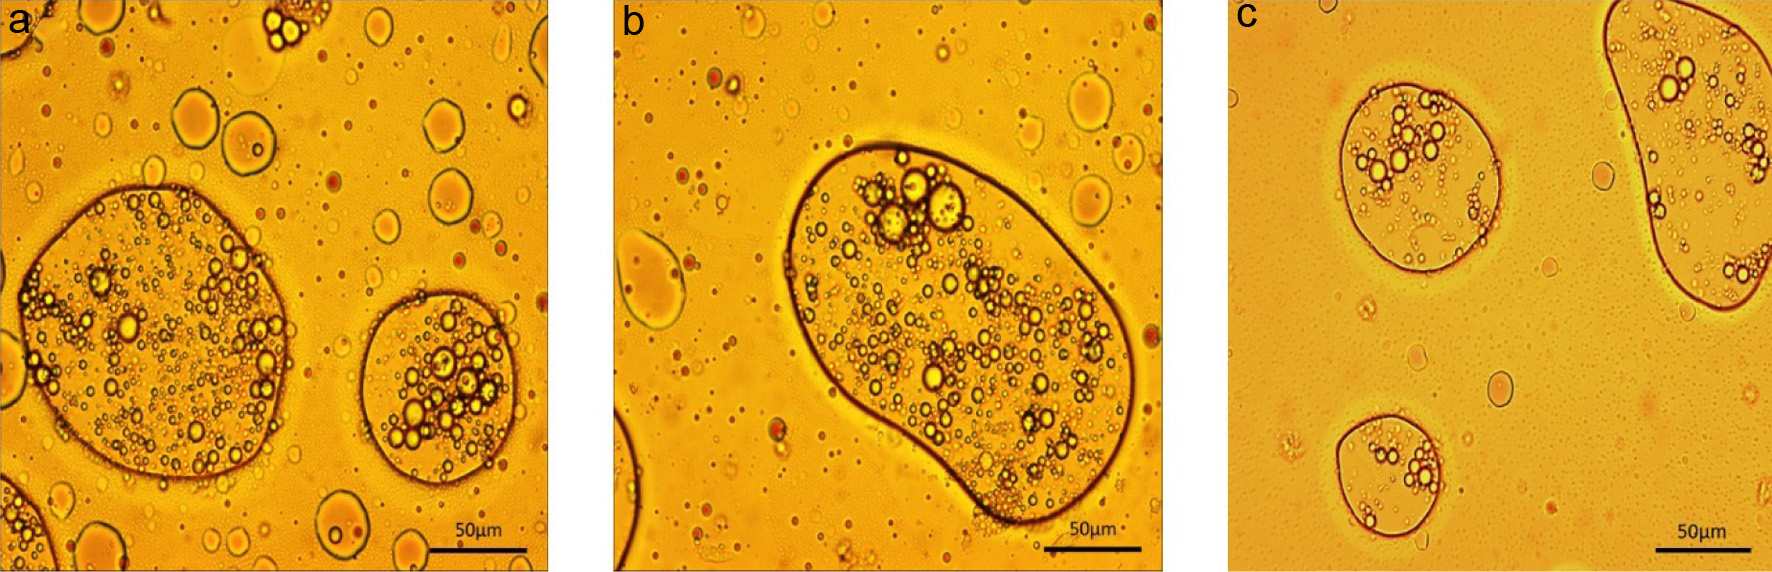
Figure 5. O/W/O double emulsion with TFE after ultrasound treatment with 81% oil, 1% psyllium husk and 18% water (a) encapsulating Vitamin E (b) and Omega-3 (c).
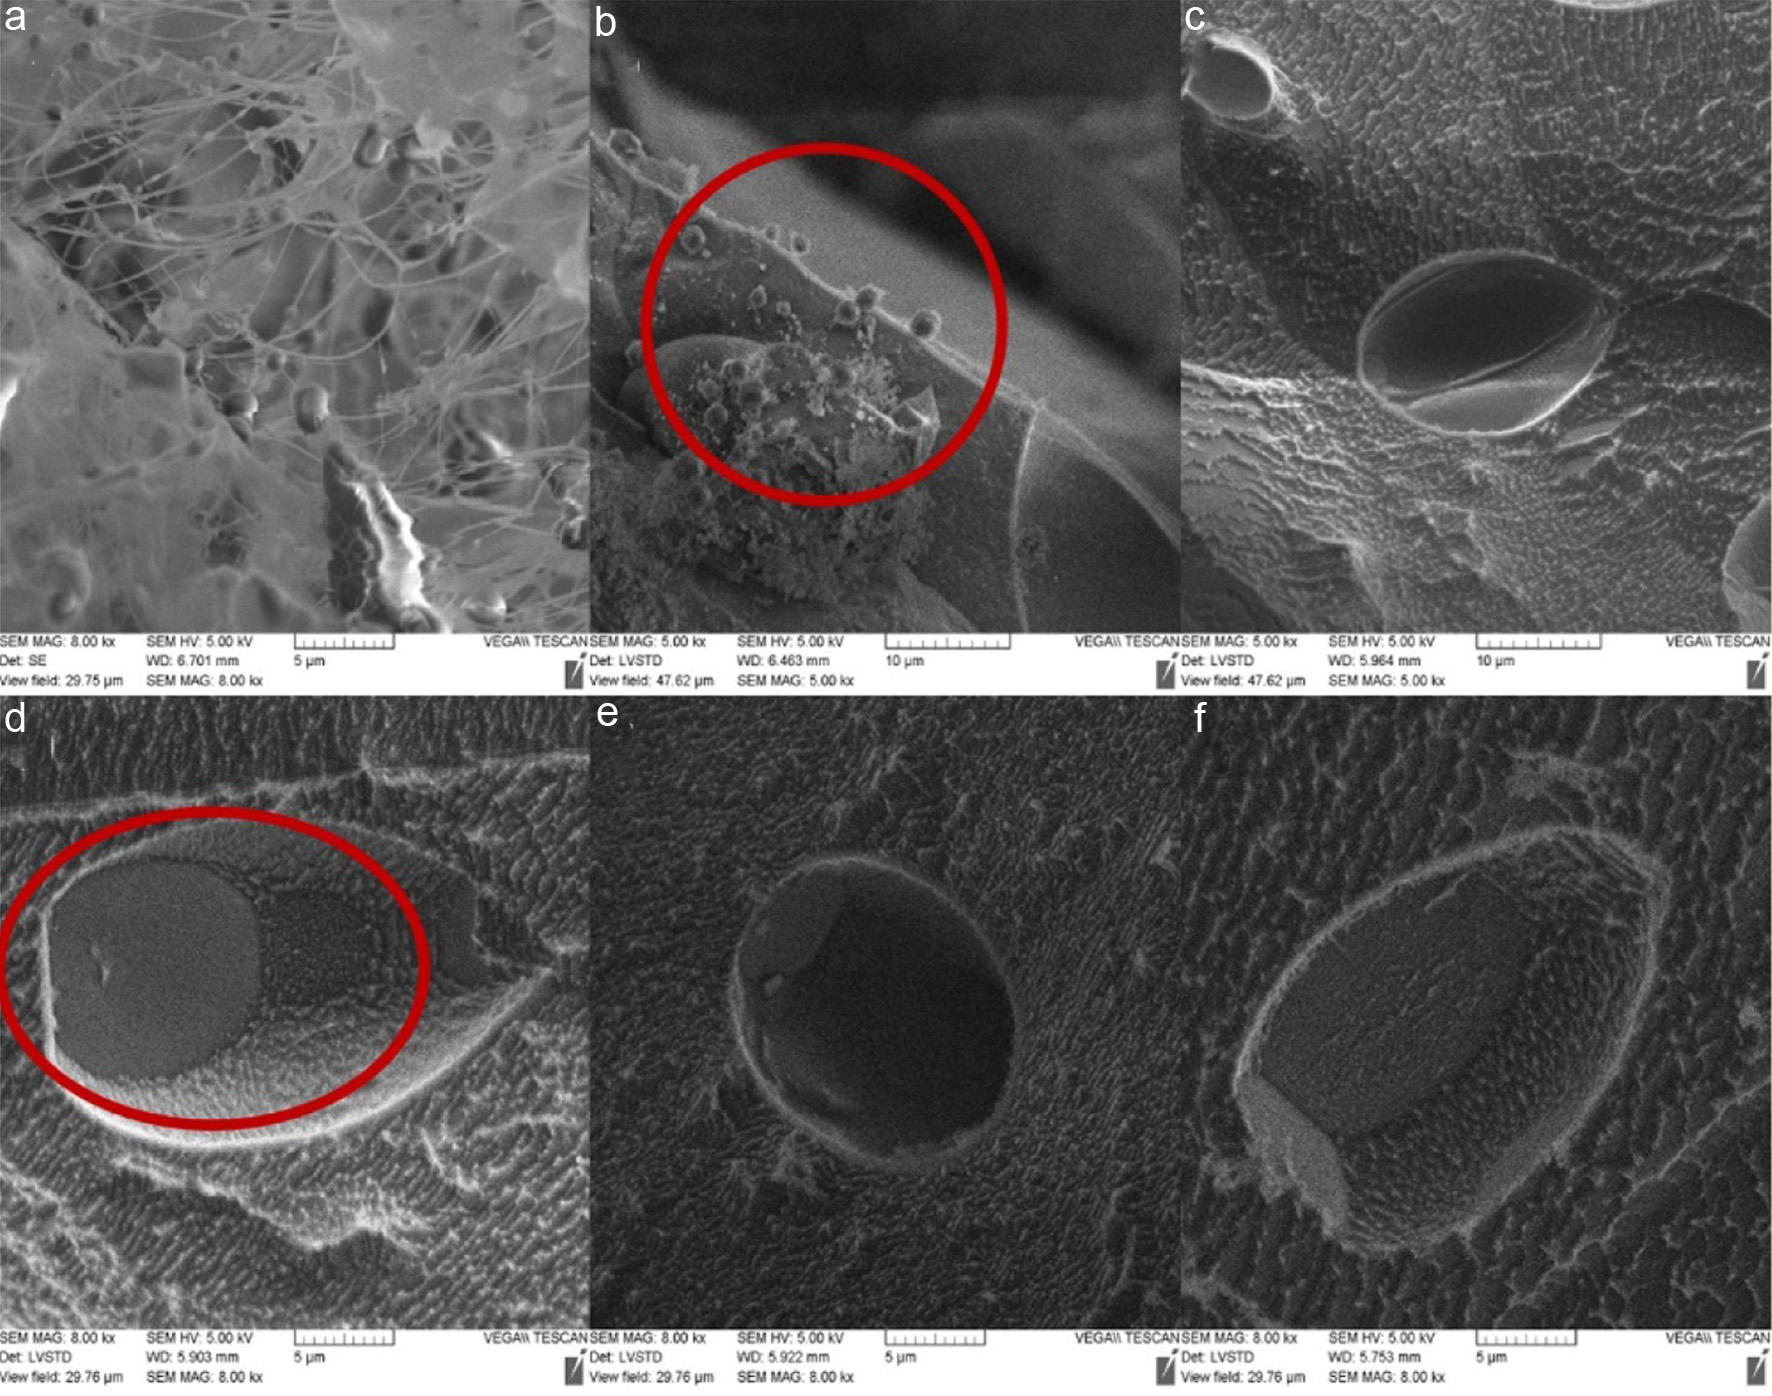
Figure 6. Cryo-SEM images of emulsions. (a) 1% concentration psyllium husk O/W single emulsions. (b) Single emulsion encapsulated inside double emulsion. (c) The overall shape of double emulsion under SEM. (d–f) The cross-sectional morphology of double emulsion under SEM.
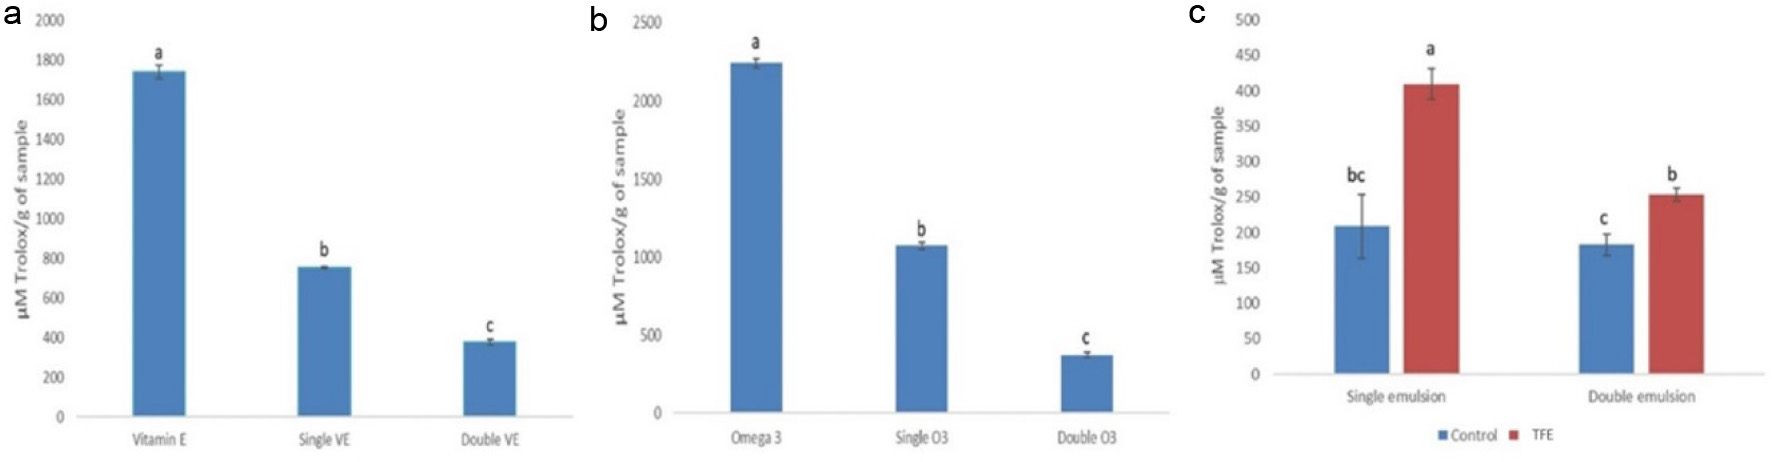
Figure 7. (a) Comparison of ORAC value of vitamin E, single emulsion encapsulating vitamin E and double emulsion encapsulation vitamin E. (b) Comparison of ORAC value of omega-3, single emulsion encapsulating omega-3 and double emulsion encapsulation omega-3. (c) Comparison of ORAC value of single and double emulsion before (blue bars) and after (red bars) loading TFE extracts. Different letters represent significant different at p < 0.05.
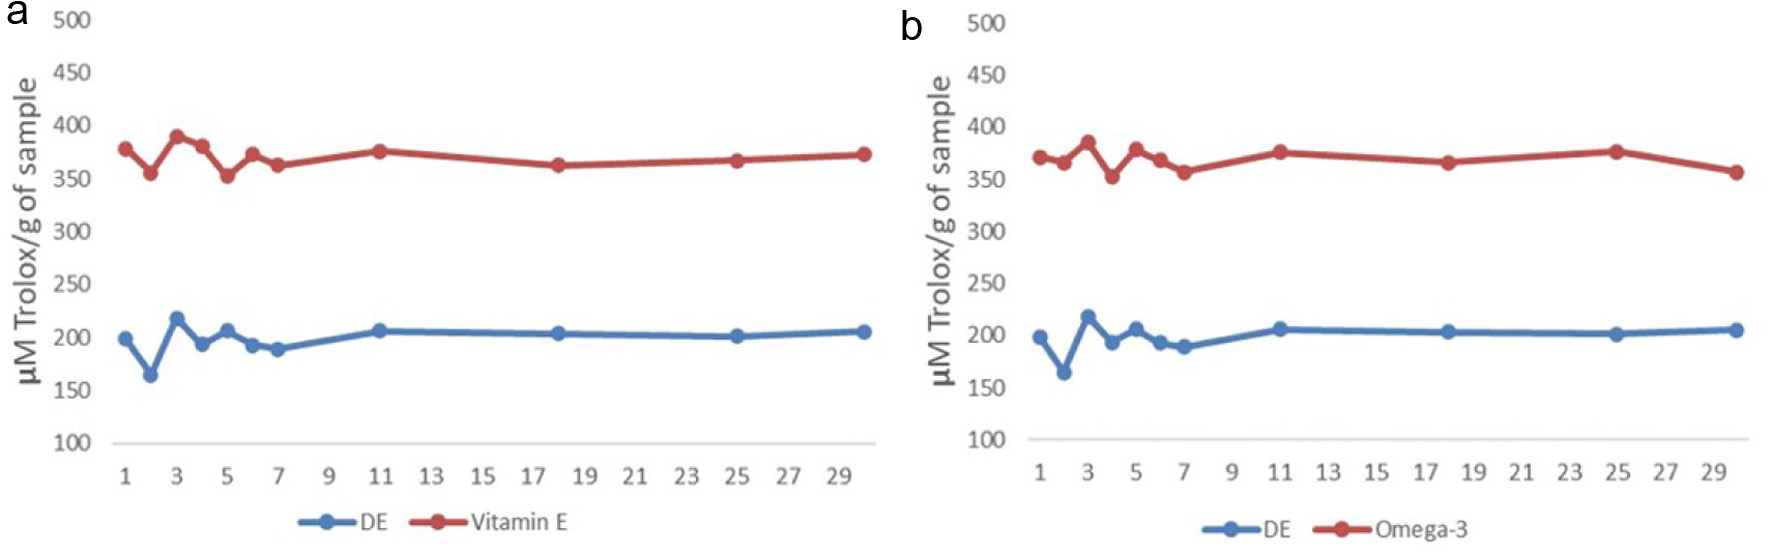
Figure 8. Comparison of antioxidant values between double emulsion loading food supplements (red line) and without loading (blue line) food supplements over 30 days in 4 °C, (a) Double emulsions loading vitamin E. (b) Double emulsions loading omega-3.
Tables
Table 1. Different formulation of primary and double emulsions
| Primary emulsions | Double emulsions |
|---|
| Water (%) | Psyllium husk (%) | Sunflower oil (%) | Primary emulsion (%) | Sunflower oil (%) |
|---|
| 1 | 94 | 1 | 5 | 5 | 95 |
| 2 | 10 | 90 |
| 3 | 20 | 80 |
| 4 | 89 | 1 | 10 | 5 | 95 |
| 5 | 10 | 90 |
| 6 | 20 | 80 |
| 7 | 79 | 1 | 20 | 5 | 95 |
| 8 | 10 | 90 |
| 9 | 20 | 80 |
Table 2. Formulation of double emulsion after encapsulation
| Primary emulsion | Double emulsion |
|---|
| Water (%) | Psyllium husk (%) | Sunflower oil (%) | TFE* (%) | Omega-3 (%) | Vitamin E** (%) | Primary emulsion (%) | Sunflower oil (%) |
|---|
| *TFE: Tannins free extract. **Vitamin E: α-tocopherol. |
| 79 | 1 | 5 | 10 | 5 | 0 | 20 | 80 |
| 79 | 1 | 5 | 10 | 0 | 5 | 20 | 80 |