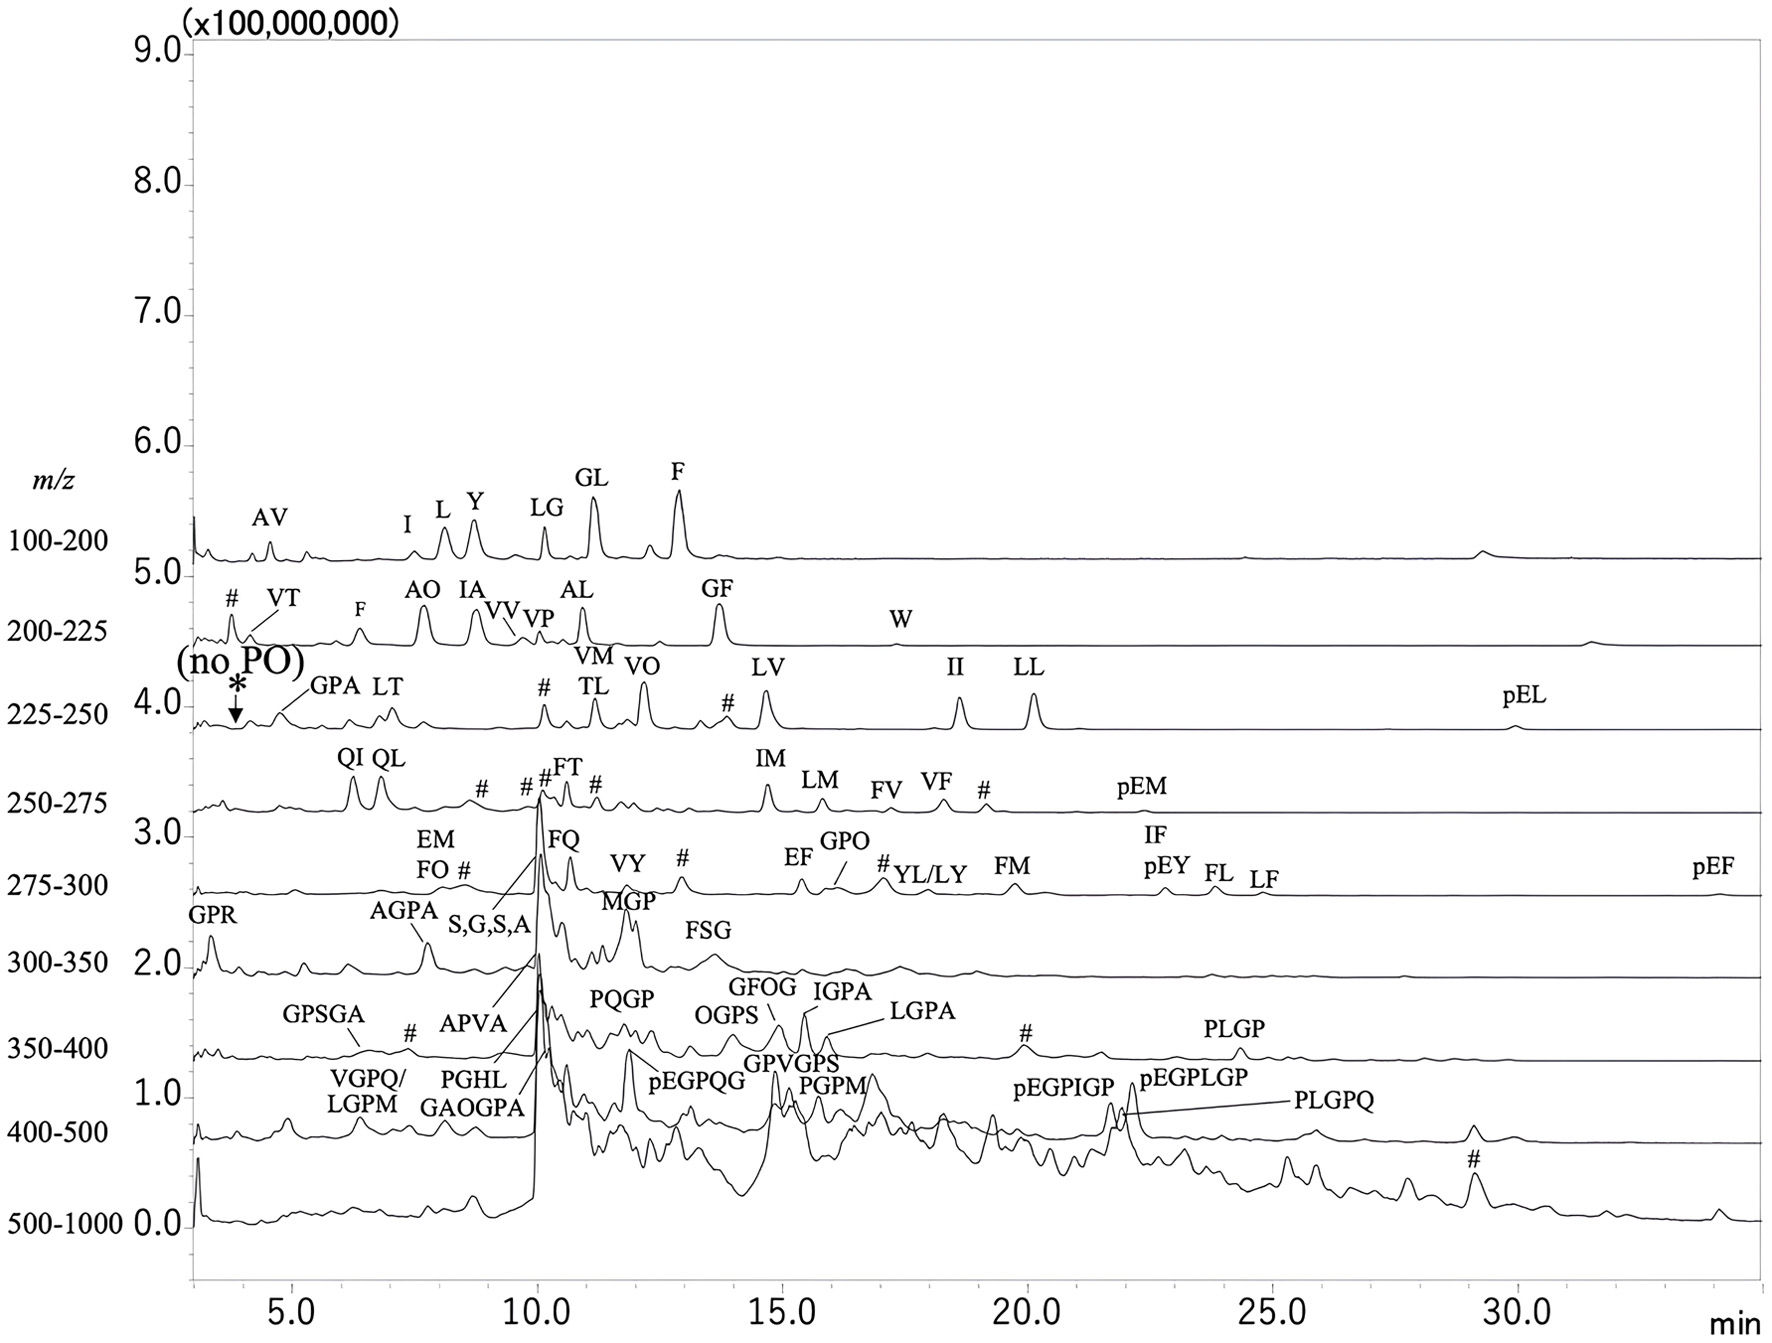
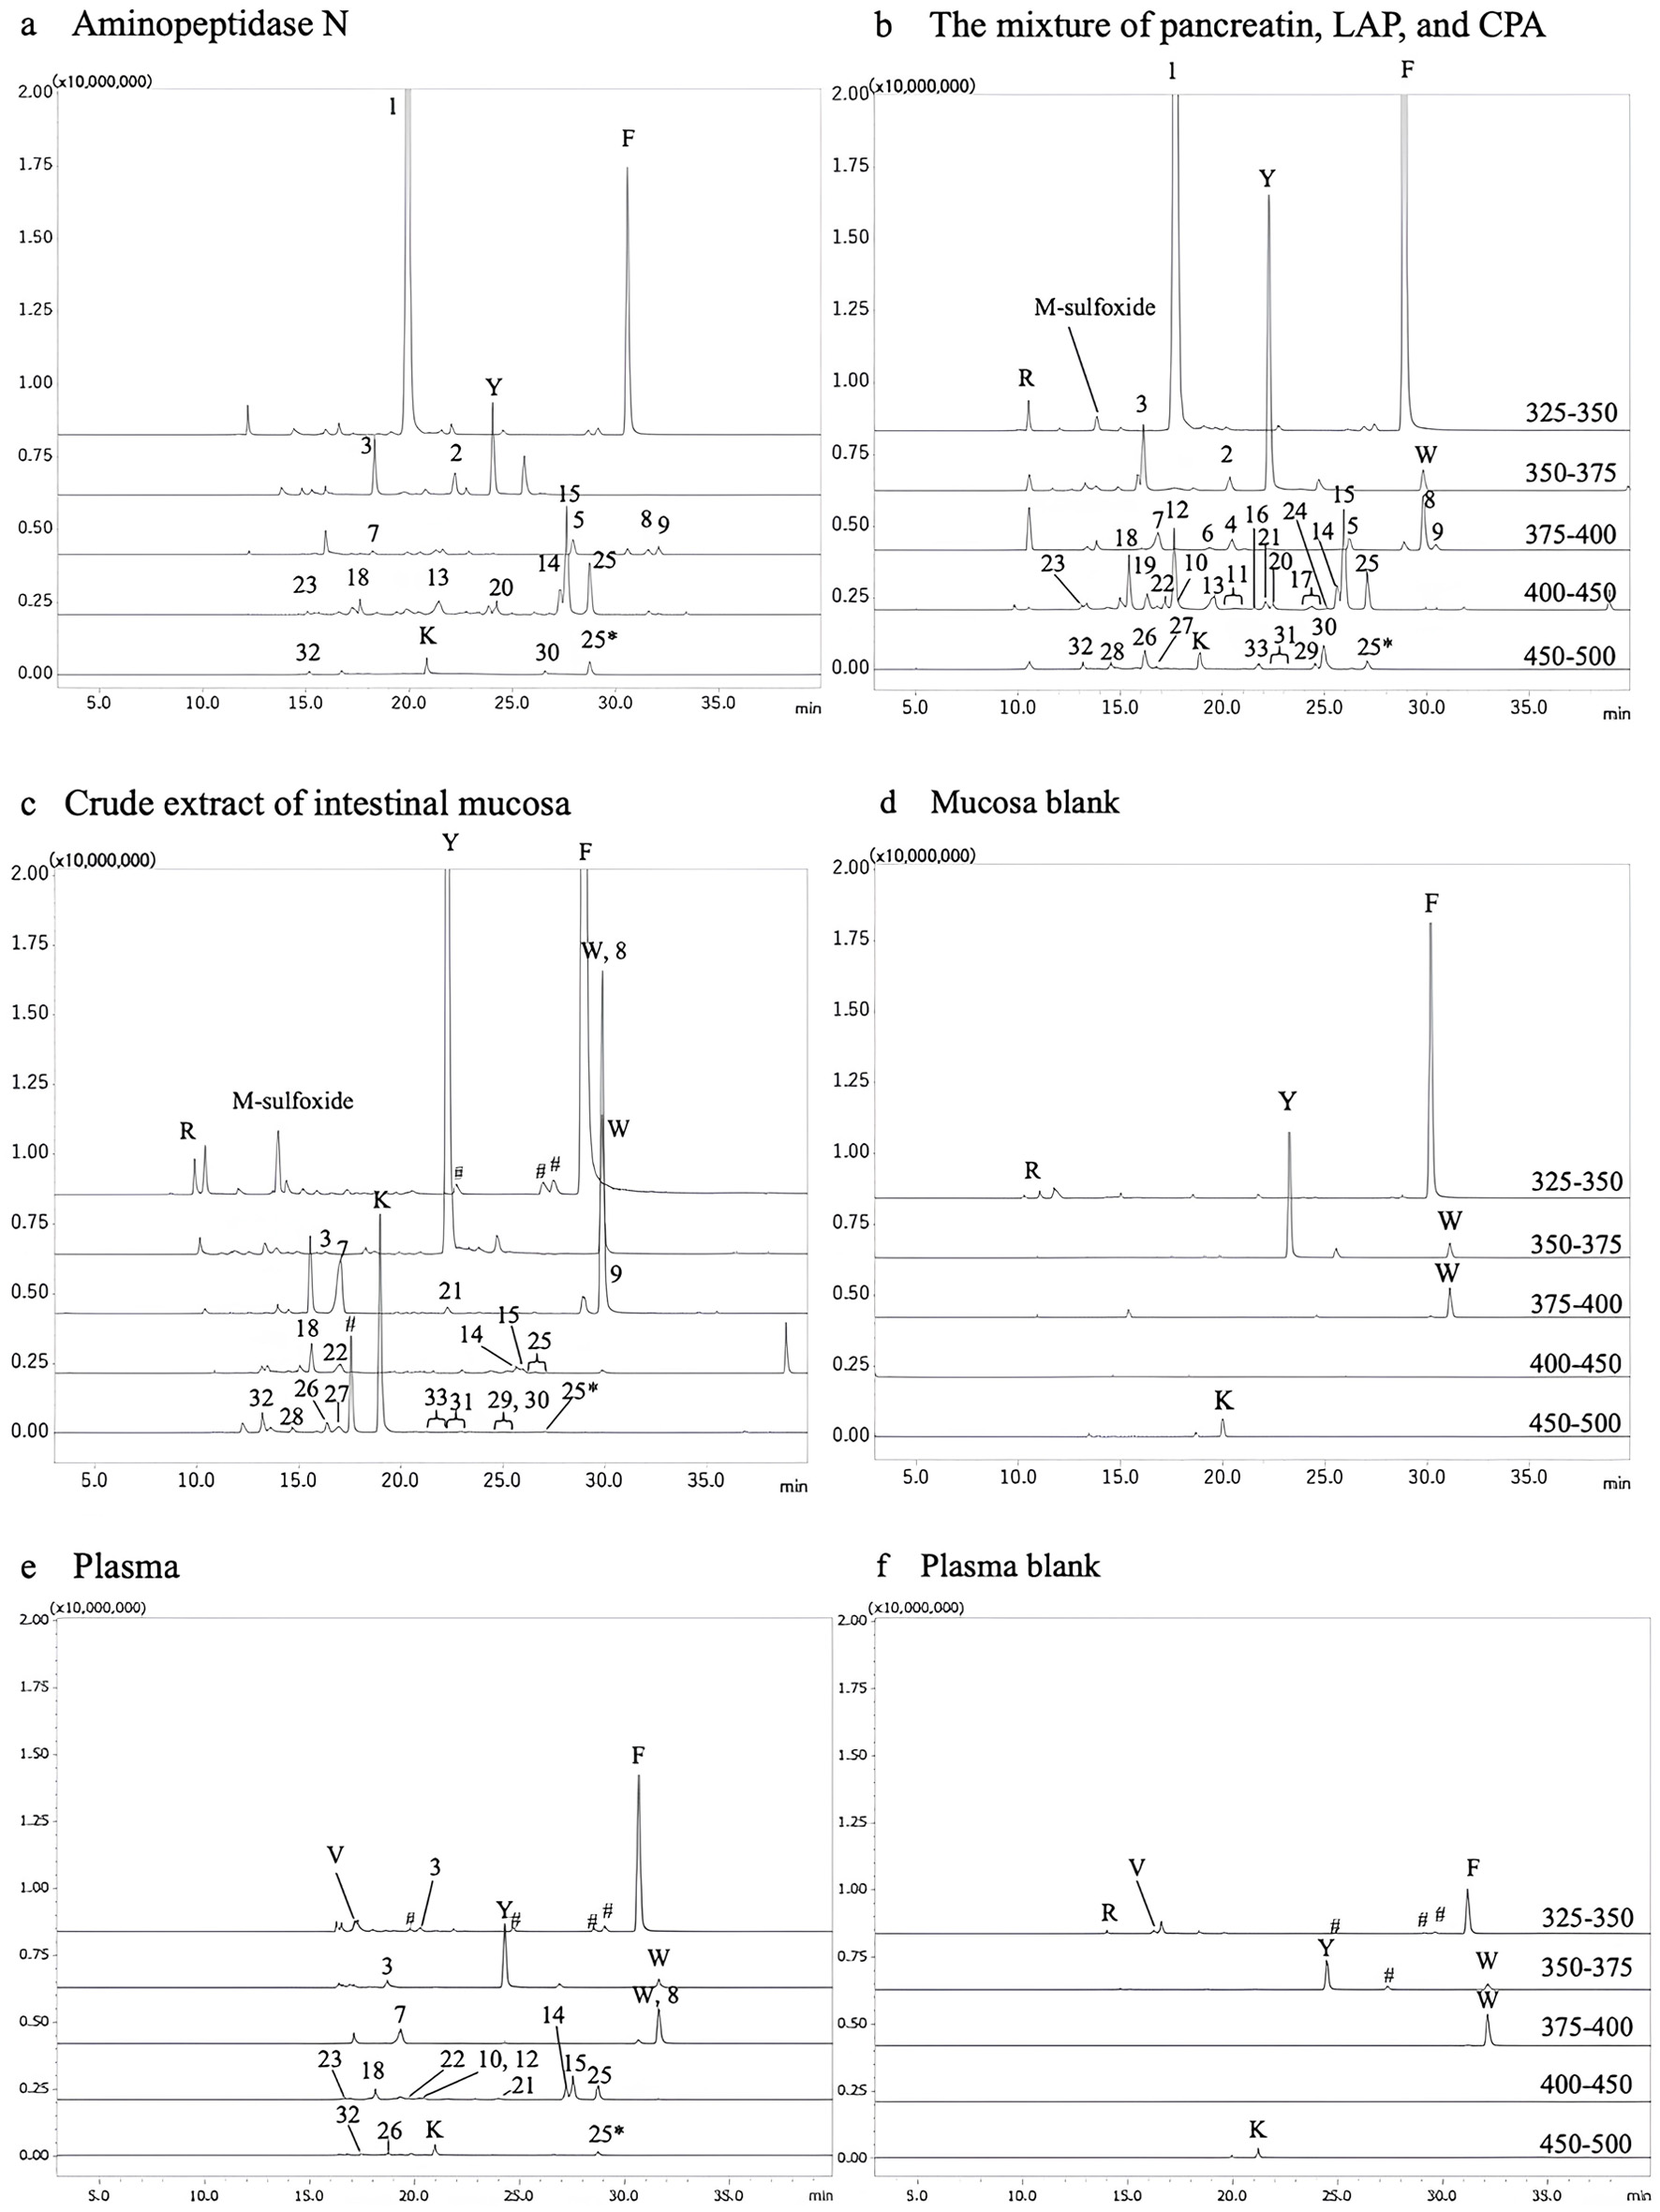
| 1 | 343 | 172 | Gly-Pro | 116.1 (y1), 171.1 (AccQ, b1), 173.2 (y2), 228.1 (b2), 343.0 (y3) |
| 2 | 357 | 186 | Ala-Pro | 44.2 (*Ala), 116.1 (y1), 171.1 (AccQ, b1), 187.1 (y2), 214.2, 242.0 (b2), 357.1 (y3) |
| 3 | 373 | 202 | Ala-Hyp | 132.0 (y1), 171.1 (AccQ, b1), 203.1 (y2), 242.1 (b2), 373.1 (y3) |
| 4 | 383 | 212 | Pro-Pro | 70.1 (*Pro), 116.2 (y1), 171.2 (AccQ, b1), 213.0 (y2), 268.1 (b2), 383.3 (y3) |
| 5 | 385 | 214 | Val-Pro | 72.0 (*Val), 116.1 (y1), 171.0 (AccQ, b1), 215.0 (y2), 242.1, 270.1 (b2), 385.2 (y3) |
| 6 | 387 | 216 | Thr-Pro | 74.3 (*Thr), 116.2 (y1), 171.2 (AccQ, b1), 217.1 (y2), 244.1, 272.3 (b2), 387.1 (y3) |
| 7 | 399 | 228 | Pro-Hyp | 70.1 (*Pro), 86.1 (*Hyp), 132.2 (Hyp), 171.1 (AccQ, b1), 229.2 (y2), 268.1 (b2), 399.1 (y3) |
| 8 | 399 | 228 | Ile-Pro | 70.1 (*Pro), 116.2 (y1), 145.2, 171.1 (AccQ, b1), 229.1, 256.1, 284.1 (b2), 399.2 (y3) |
| 9 | 399 | 228 | Leu-Pro | 70.2 (*Pro), 116.1 (y1), 145.1, 171.3 (AccQ, b1), 229.2, 256.1, 284.1 (b2), 399.1 (y3) |
| 10 | 401 | 230 | Asp-Pro | 70.1 (*Pro), 116.1 (y1), 171.0 (AccQ, b1), 213.1, 231.0 (y2), 286.1 (b2) |
| 11 | 403 | 232 | Asp-Val | 72.0 (*Val), 88 (*Asp), 118.1 (y1), 145.2, 171.1 (AccQ, b1), 233.1 (y2), 259.1 (a2), 286.2 (b2), 403.1 (y3) |
| 12 | 414 | 243 | Gly-Pro-Ala | 70.0 (*Pro), 127.1, 155.1, 171.2 (AccQ, b1), 187.3, 200.1, 228.2 (b2), 244.2, 414.4 (y4) |
| 13 | 415 | 244 | Glu-Pro | 70.3 (*Pro), 84.1, 116.2 (y1), 145.0, 171.1, 227.1, 245.0 (y2), 272.1, 300.2 (b2), 415.1 (y3) |
| 14 | 415 | 244 | Ile-Hyp | 86.1 (*Ile), 132.1 (y1), 171.0 (AccQ, b1), 245.0 (y2), 256.1, 283.9 (b2), 414.9 (y3) |
| 15 | 415 | 244 | Leu-Hyp | 86.1 (*Leu), 132.1 (y1), 171.0 (AccQ, b1), 245.0 (y2), 256.1, 283.9 (b2), 414.9 (y3) |
| 16 | 417 | 246 | Leu-Asp | 86.2 (*Ile/Leu), 88 (*Asp), 144.6, 170.9 (AccQ, b1), 256.1, 285.2, 416.9 (y3) |
| 17 | 417 | 246 | Met-Pro | 56.3, 60.8, 104 (*Met), 115.8 (y1), 170.8 (AccQ, b1), 246.9 (y2), 273.9, 301.9 (b2), 416.7 (y3) |
| 18 | 430 | 259 | Ala-Hyp-Gly | 44.4 (*Ala), 86.1 (*Hyp), 144.9, 171.0 (AccQ, b1), 189.0 (y2), 213.6 (a2), 242.1 (b2), 258.6 (y3), 430 (y4) |
| 19 | 430 | 259 | Gly-Pro-Ser | 70.1 (*Pro), 88.3 (*Asp), 106 (y1), 127.0, 145, 171.1 (AccQ, b1), 200.1 (a2), 203.0 (y2), 227.8 (b2), 242.0, 260.0 (y3), 268.3 (b2), 429.7 (y4) |
| 20 | 433 | 262 | Met-Hyp | 55.8, 86.5 (*Hyp), 104.3 (*Met), 132.0 (y1), 170.9 (AccQ, b1), 263.1, 302.3 (b2), 433.0 (y3) |
| 21 | 442 | 271 | Gly-Pro-Val | 70.2 (*Pro), 72 (*Val), 116 (y1), 117.9 (y1), 145.0, 171.0 (AccQ, b1), 200 (a2), 215.3 (y2), 228 (b2), 272.1 (y3), 442.1 (y4) |
| 22 | 444 | 273 | Gly-Pro-Thr | 70.0 (*Pro), 127.0, 171.0 (AccQ, b1), 186.9, 200 (a2), 217.0 (y2), 227.9 (b2), 256.1, 273.9 (y3), 444 (y4) |
| 23 | 446 | 275 | Ser-Hyp-Gly | 60.1 (*Ser), 86.1 (*Hyp), 145.2, 171.0 (AccQ, b1), 189.8 (y2), 201.1, 229.6, 258.0 (b2), 275.9, 446.3 (y4) |
| 24 | 449 | 278 | Tyr-Pro | 116.1 (y1), 136.2 (*Tyr), 171.0 (AccQ, b1), 278.8 (y2), 306.2 (a2), 334.1 (b2), 448.8 (y4) |
| 25 | 449 | 278 | Phe-Hyp | 120.2 (*Phe), 132.0 (y1), 171.0 (AccQ, b1), 279.1 (y2), 289.9, 318.1 (b2), 448.9 (y4) |
| 25* | 450 | 279 | Phe-Hyp* | 120.1 (*Phe), 132.3 (y1), 144.6, 171.0 (AccQ, b1), 279.9 (y2), 290.5 (a2), 317.6 (b2), 449.7 (y4) |
| 26 | 456 | 285 | Pro-Hyp-Gly | 70.3 (*Pro), 86.3 (*Hyp), 141.0, 171.1 (AccQ, b1), 189.5 (y2), 286.1 (y3), 455.9 (y4) |
| 27 | 456 | 285 | Gly-Pro-Hyp | 30.1 (*Gly), 70.2 (*Pro), 132.1 (y1), 171.1 (accQ, b1), 229.1 (b2, y2), 286.2 (y3), 456.1 (y4) |
| 28 | 460 | 289 | Thr-Hyp-Gly | 74 (*Thr), 86.1 (*Hyp), 145.1, 171.3 (AccQ, b1), 189.1 (y2), 244, 2 (a2), 71.7 (b2), 289.8 (y3), 459.3 |
| 29 | 472 | 301 | Ile-Hyp-Gly | 86.5 (*Ile), 171.0 (AccQ, b1), 188.9 (y2), 255.8 (a2), 283.7 (b2), 302 (y3), 472 (y4) |
| 30 | 472 | 301 | Leu-Hyp-Gly | 86.2 (*Leu), 170.8 (AccQ, b1), 188.8 (y2), 226.4, 256.1 (a2), 283.9 (b2), 302 (y3), 471.8 (y4) |
| 31 | 474 | 303 | Gly-Pro-Met | 70.0 (*Pro), 127.0, 155.2, 170.8 (AccQ, b1), 200.2 (a2), 227.7 (b2), 246.5 (y2), 285.3, 304.1 (y3), 473.1 |
| 32 | 488 | 317 | Glu-Hyp-Gly | 76.6, 85.2 (*Hyp), 102 (*Glu), 145.3, 170.6 (AccQ, b1), 189.3 (y2), 224.8, 272.1 (a2), 300.0 (b2), 487.8 (y4) |
| 33 | 490 | 319 | Met-Hyp-Gly | 55.7, 85.5 (*Hyp), 104.3 (*Met), 131.9 (y1), 170.7 (AccQ, b1), 188 (y2), 273.7, 301.6 (b2), 319.4, 489.6 (y4) |
| 34 | 506 | 335 | Phe-Hyp-Gly | 86.0 (*Hyp), 119.8 (*Phe), 145.2, 170.9 (AccQ, b1), 189 (y2), 289.7, 317.6 (b2), 335.8 (y3), 505.3 |
