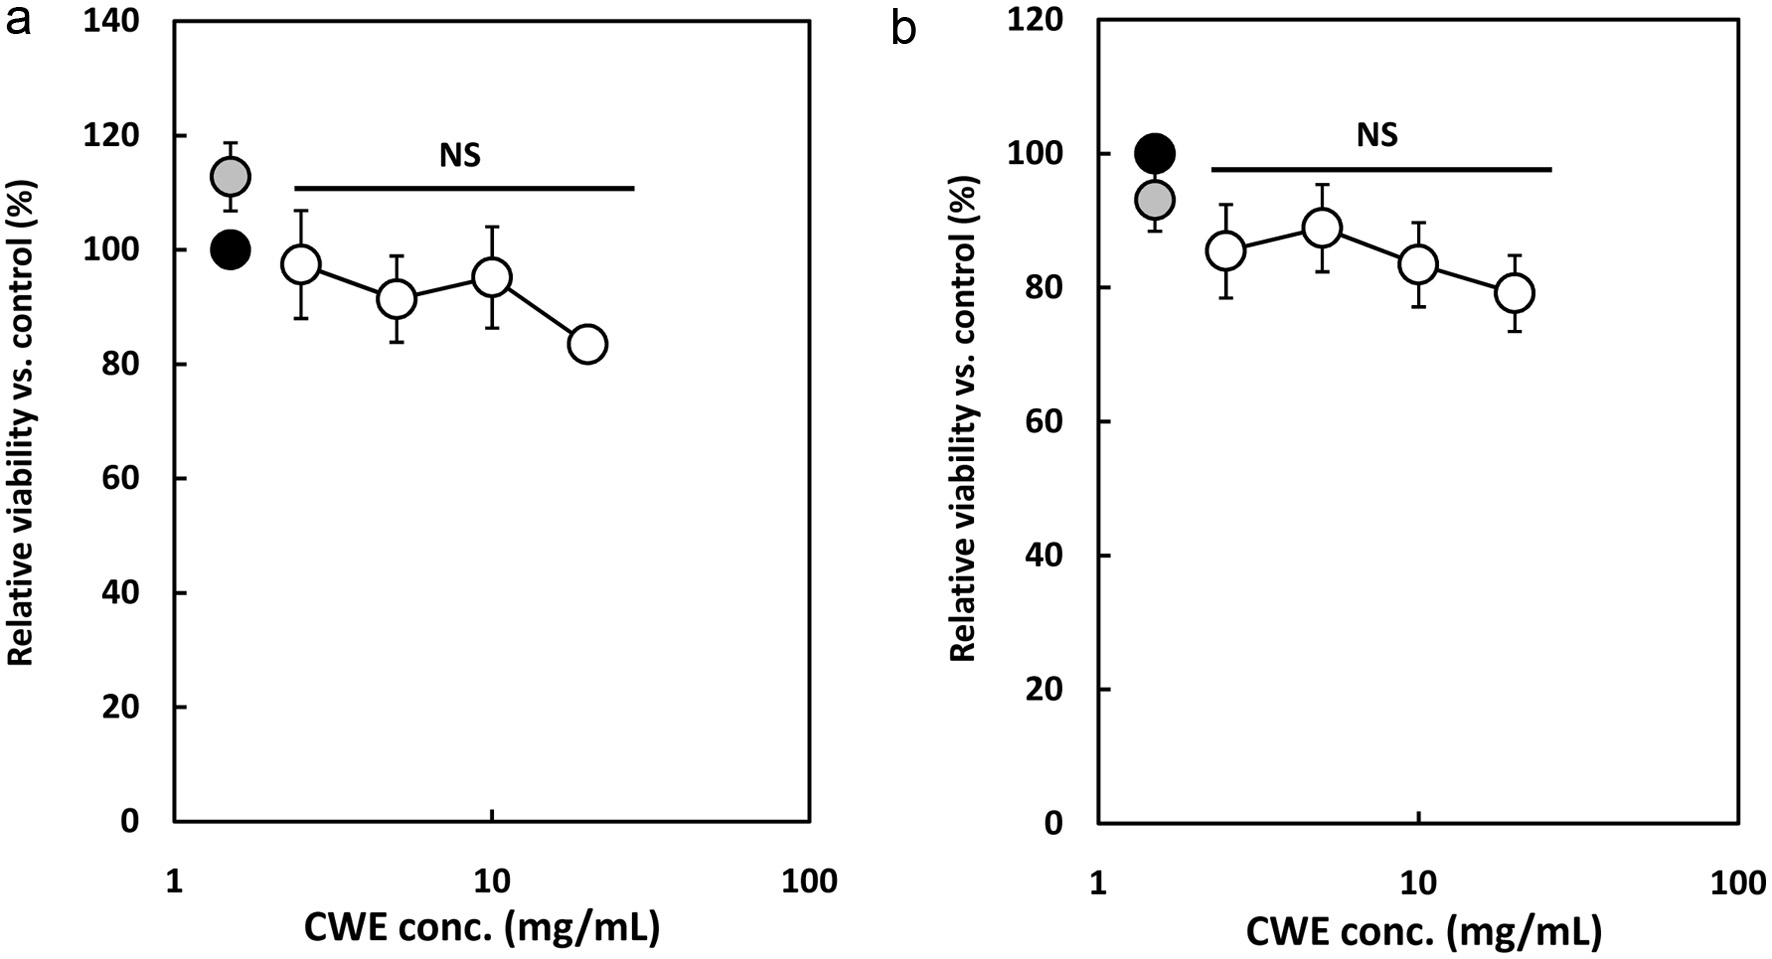
Figure 1. Effect of clove water extract (CWE) on the cell viability of lipopolysaccharide (LPS)-stimulated RAW264.7 cells and mouse peritoneal macrophages (P-mac). The RAW264.7 cells and P-mac were treated with 1 μg/mL of LPS and serial concentrations of CWE for 6 h. Relative viable cell number was then measured using a WST-8 reagent. Data are presented as the mean ± SD (n = 3). NS indicates no statistical significance against control (LPS) using the Tukey test. (a) RAW264.7 cells. (b) P-mac. Black circle: LPS without CWE (control); grey circle: distilled water without LPS (blank); open circles: LPS with CWE.
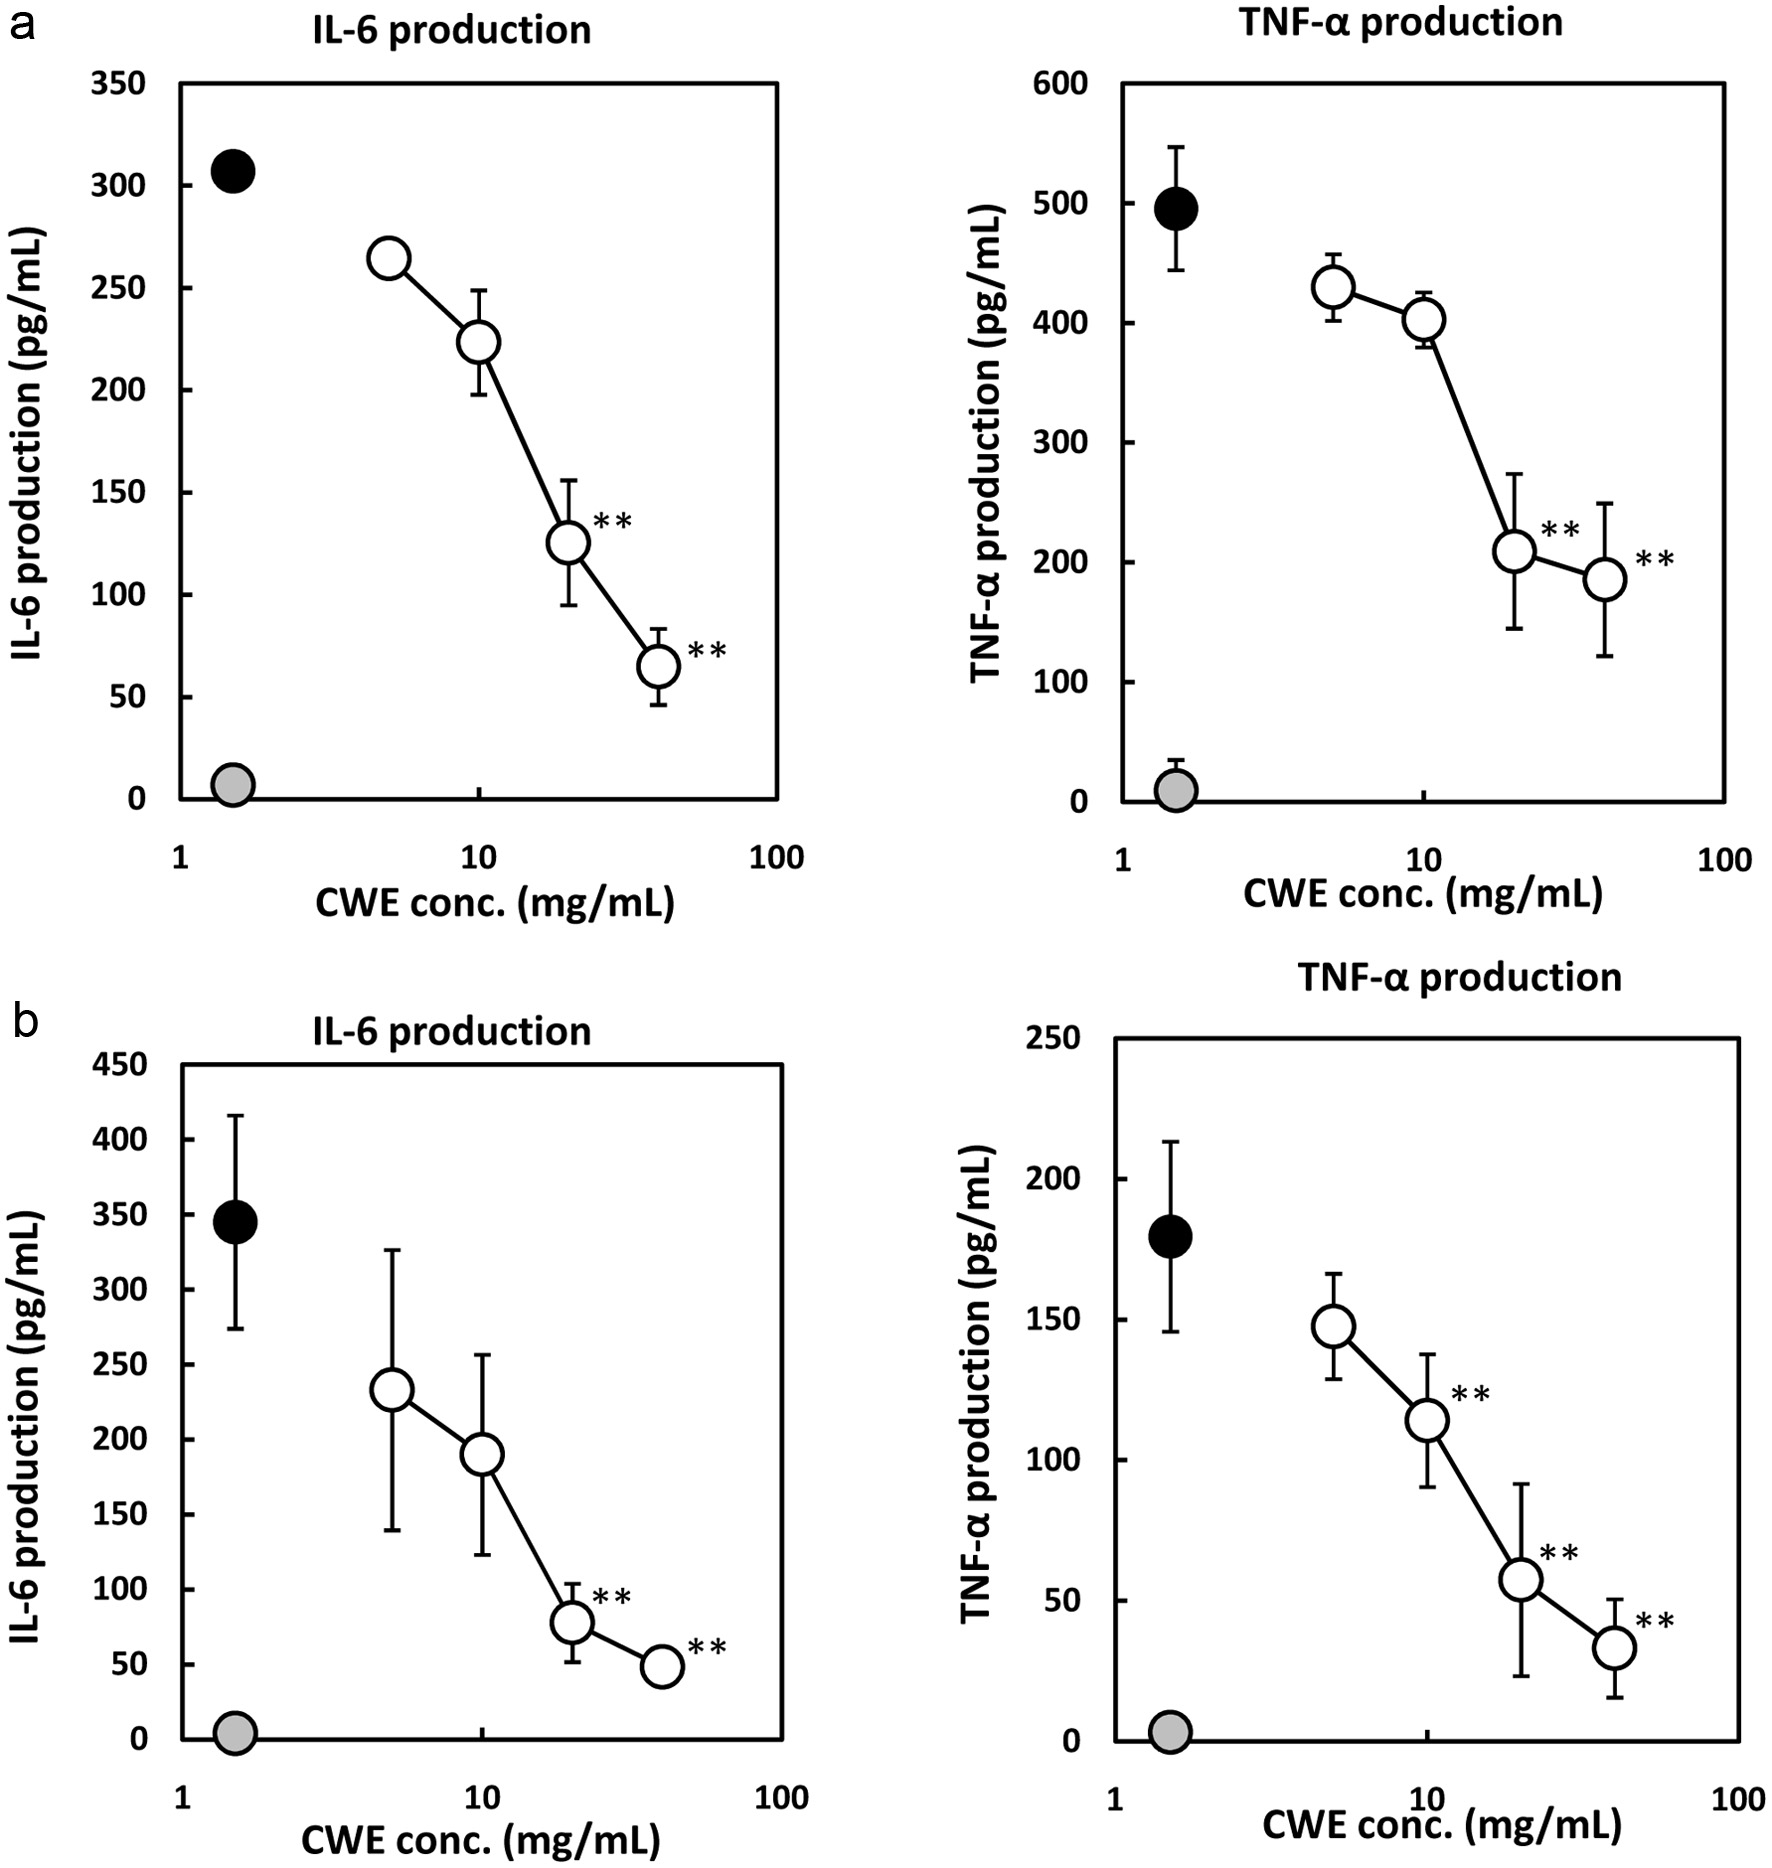
Figure 2. Effect of CWE on IL-6 and TNF-α production by LPS-stimulated RAW264.7 cells and mouse peritoneal macrophages (P-mac). The RAW264.7 cells and P-mac were treated with 1 μg/mL of LPS and serial concentrations of CWE for 6 h. The culture medium was subsequently used for measurement with the ELISA kits. Data are presented as the mean ± SD (n = 3). **p < 0.01 against control (LPS) using the Tukey test. (a) RAW264.7 cells. (b) P-mac. Black circle: LPS without CWE (control); grey circle: distilled water without LPS (blank); open circle: LPS with CWE.
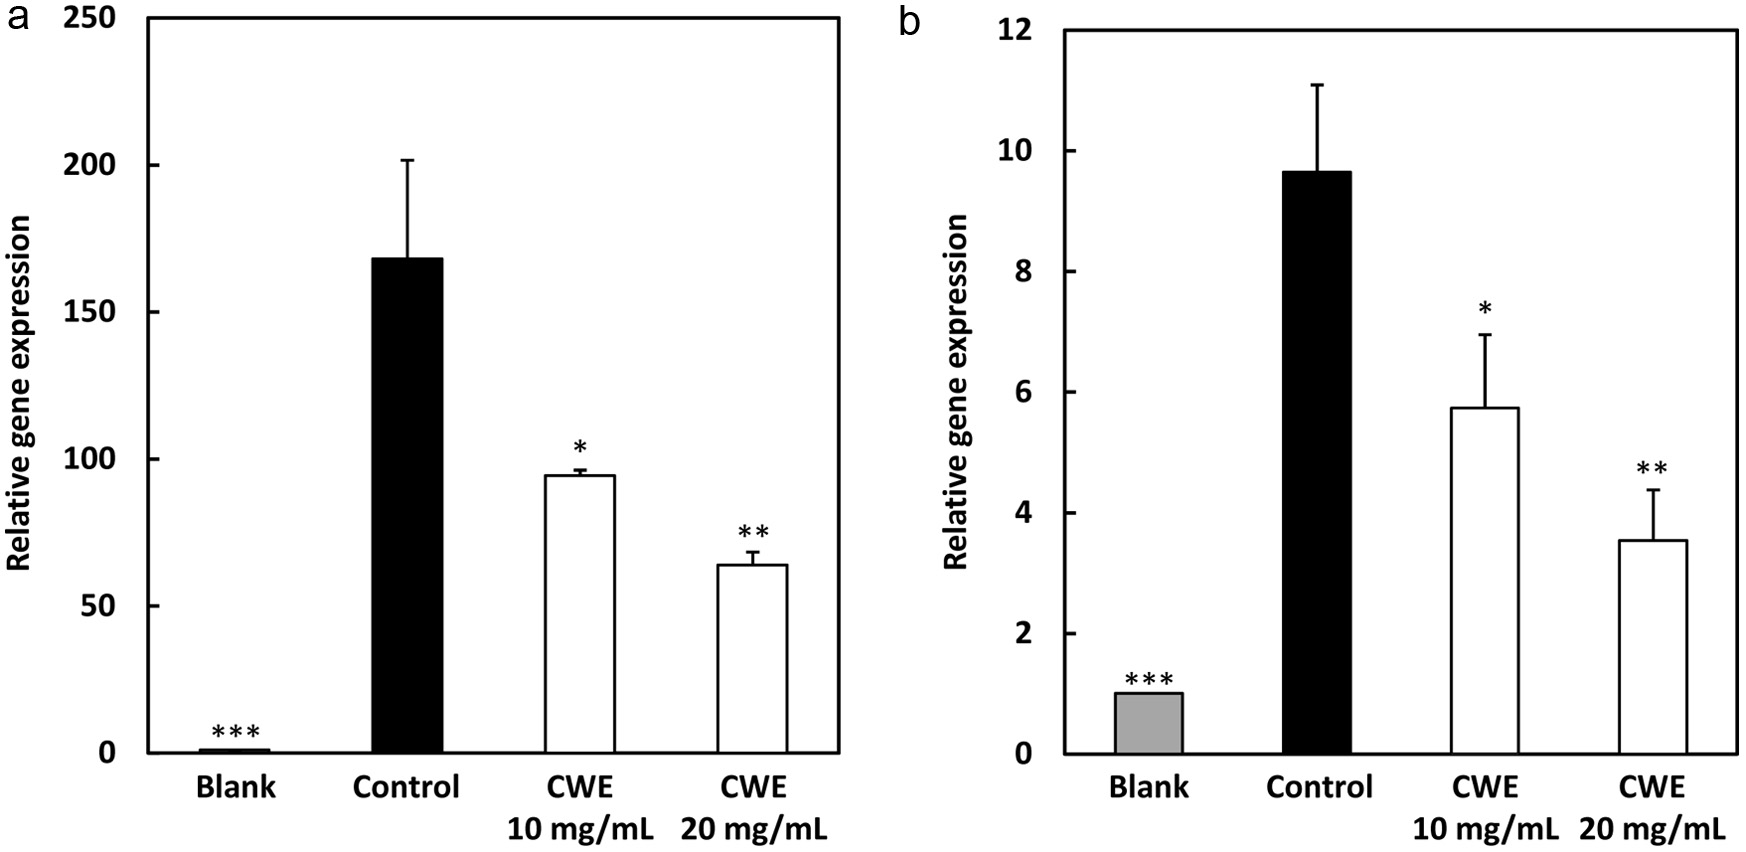
Figure 3. Effect of CWE on mRNA expression levels of IL-6 and TNF-α in LPS-stimulated RAW264.7 cells. The RAW264.7 cells were treated with 1 μg/mL of LPS and serial concentrations of CWE and incubated for 6 h. After incubation, the mRNA expression levels of IL-6 and TNF-α were evaluated using real-time RT-PCR. Data are presented as the mean ± SD (n = 3). *p < 0.05, **p < 0.01, ***p < 0.001 against control (LPS) using the Tukey test. Blank: distilled water without LPS; Control: distilled water with LPS.
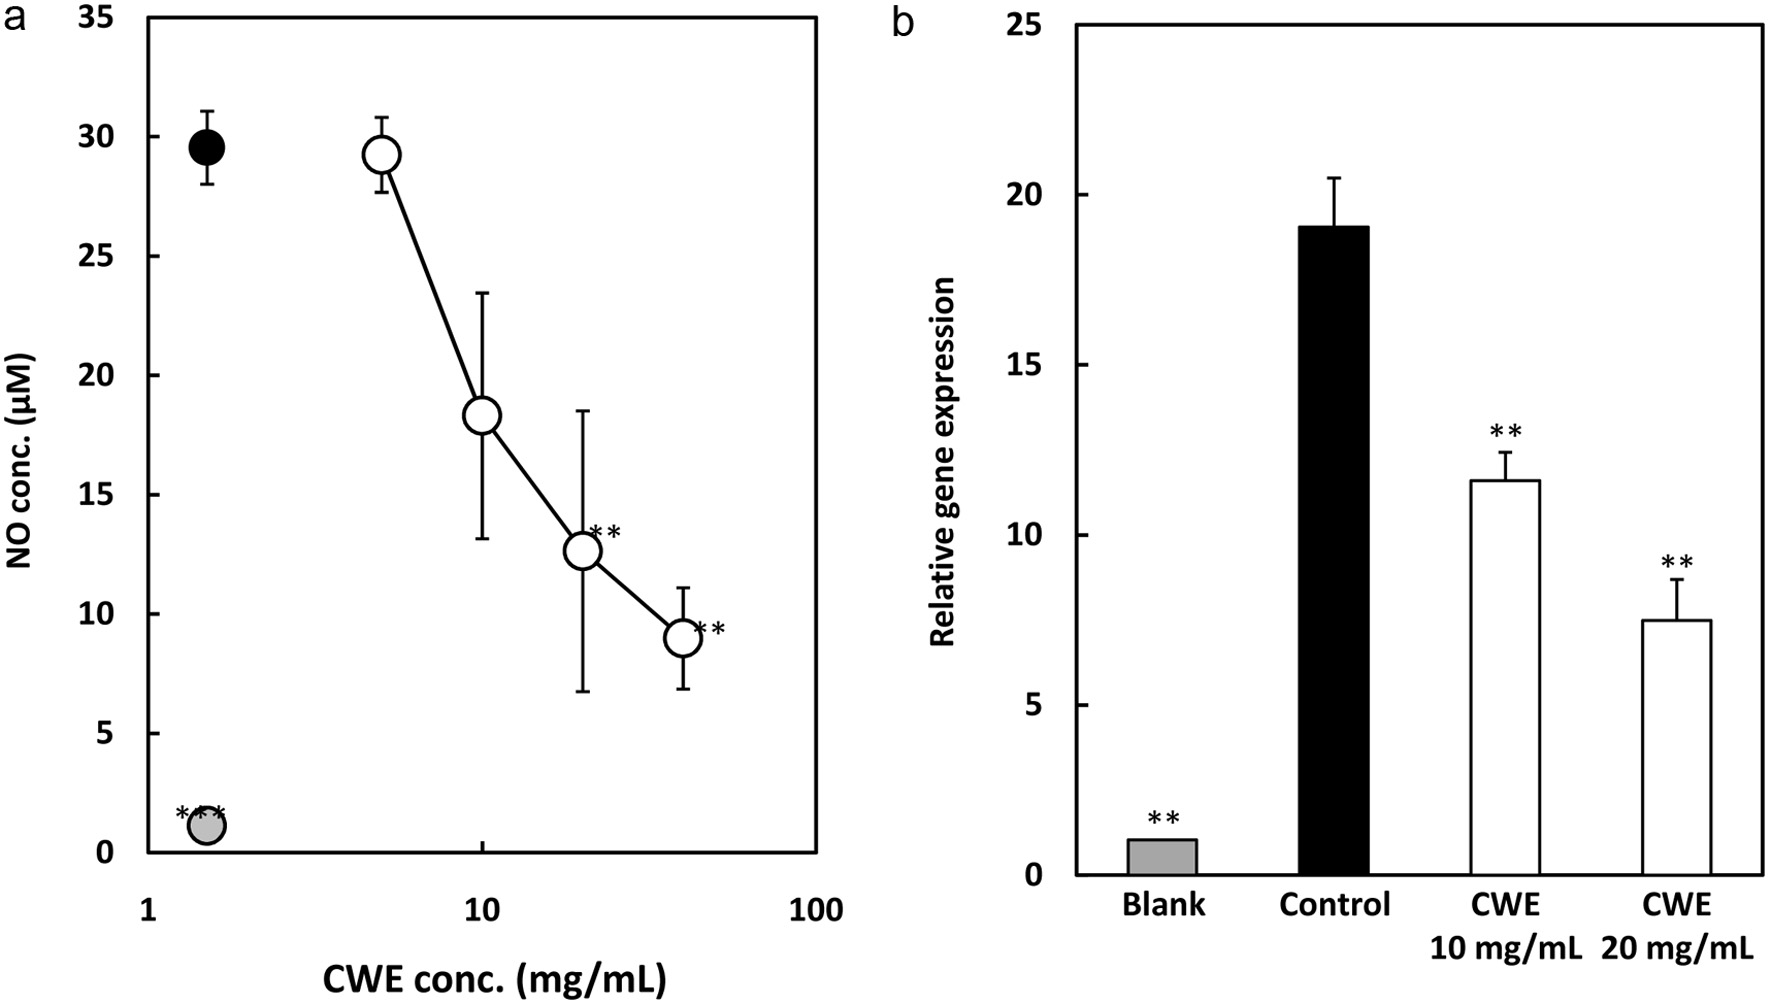
Figure 4. Effect of CWE on NO production and mRNA expression of iNOS in LPS-stimulated RAW264.7 cells. The RAW264.7 cells were treated with 1 μg/ml LPS and serial concentrations of CWE for 6 h. The culture medium was subsequently used to measure NO concentration. Data are presented as the mean ± SD (n = 3). **p < 0.01, ***p < 0.001 against control (LPS) using the Tukey test. (a) NO production. Black circle: LPS without CWE (control); grey circle: distilled water without LPS (blank); open circle: LPS with CWE. (b) iNOS gene expression level.
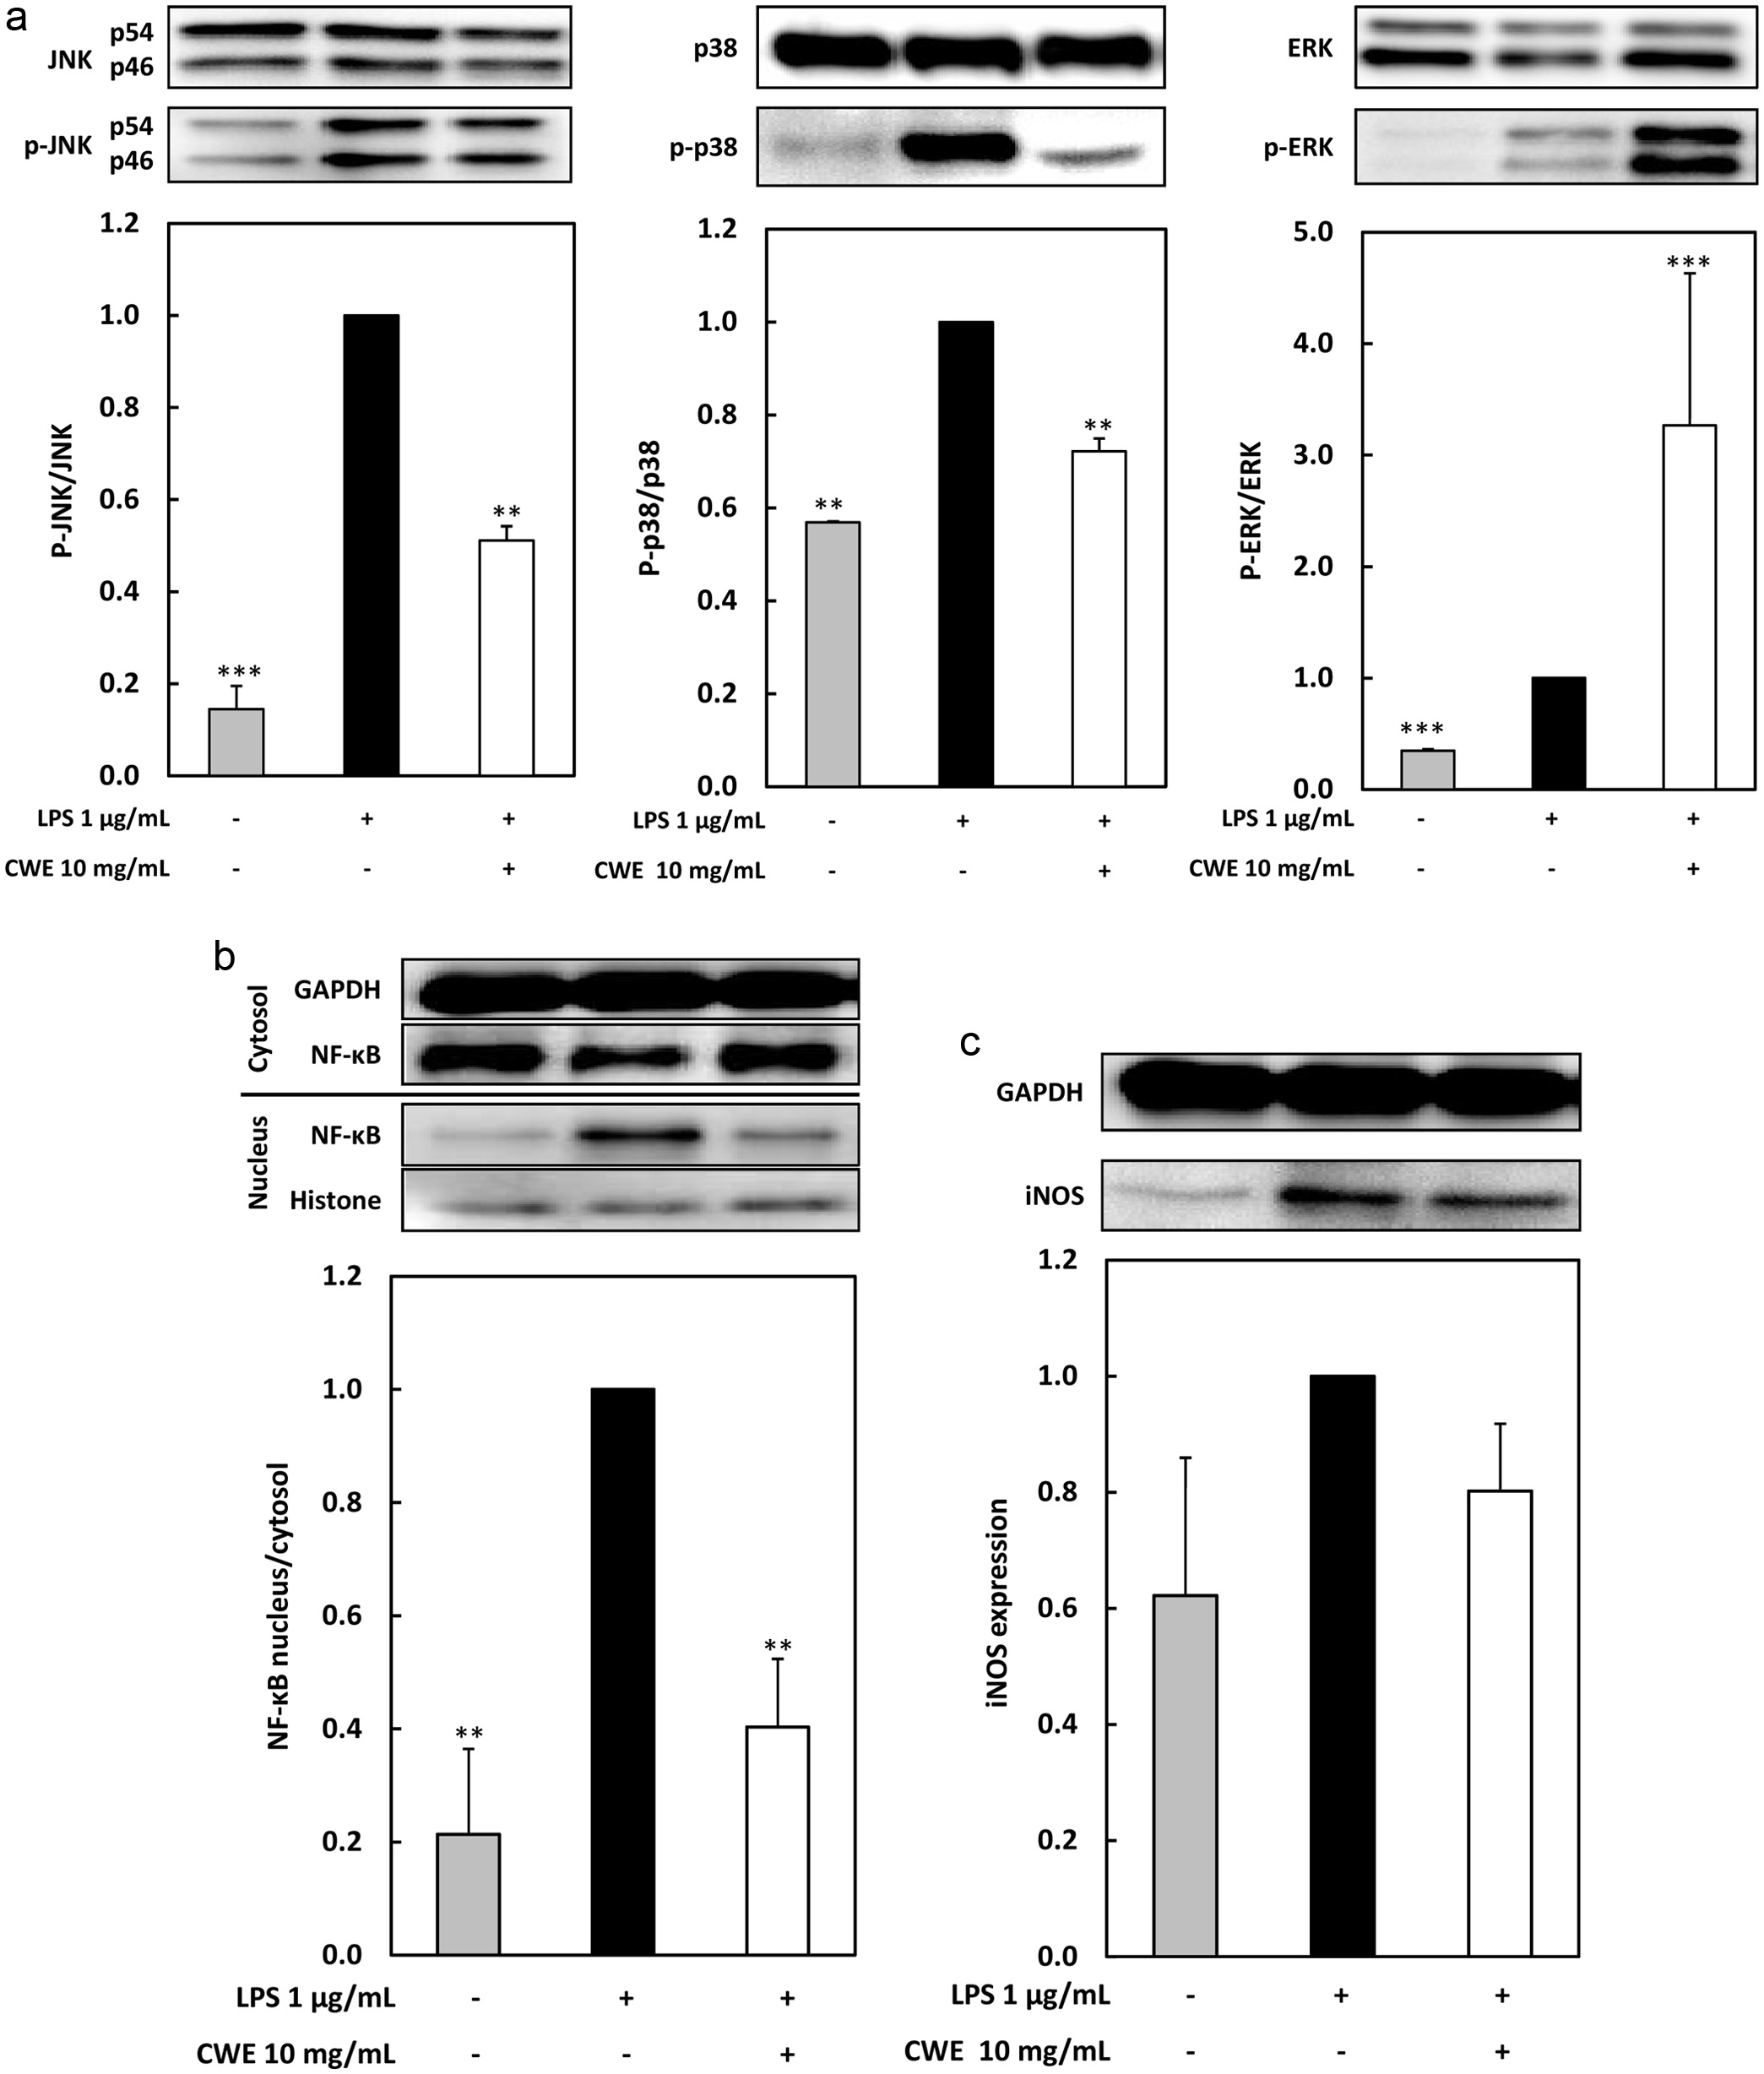
Figure 5. Effect of CWE on MAPK and NF-κB signaling pathways, and iNOS protein expression, in LPS-stimulated RAW264.7 cells. The RAW264.7 cells were treated with 1 μg/mL of LPS and serial concentrations of CWE and incubated for 15 min. (a) The phosphorylated protein levels of ERK, JNK, and p38 were evaluated using immunoblot analysis. p-ERK, p-JNK, and p-p38 represent phosphorylated ERK, JNK, and p38, respectively. (b) The protein amounts of cytosolic and nuclear NF-κB were evaluated using immunoblot analysis. (c) The protein amount of iNOS was evaluated using immunoblot analysis. Data are presented as the mean ± SD (n = 3). **p < 0.01, ***p < 0.001 against control (LPS) using the Tukey test.