Figures
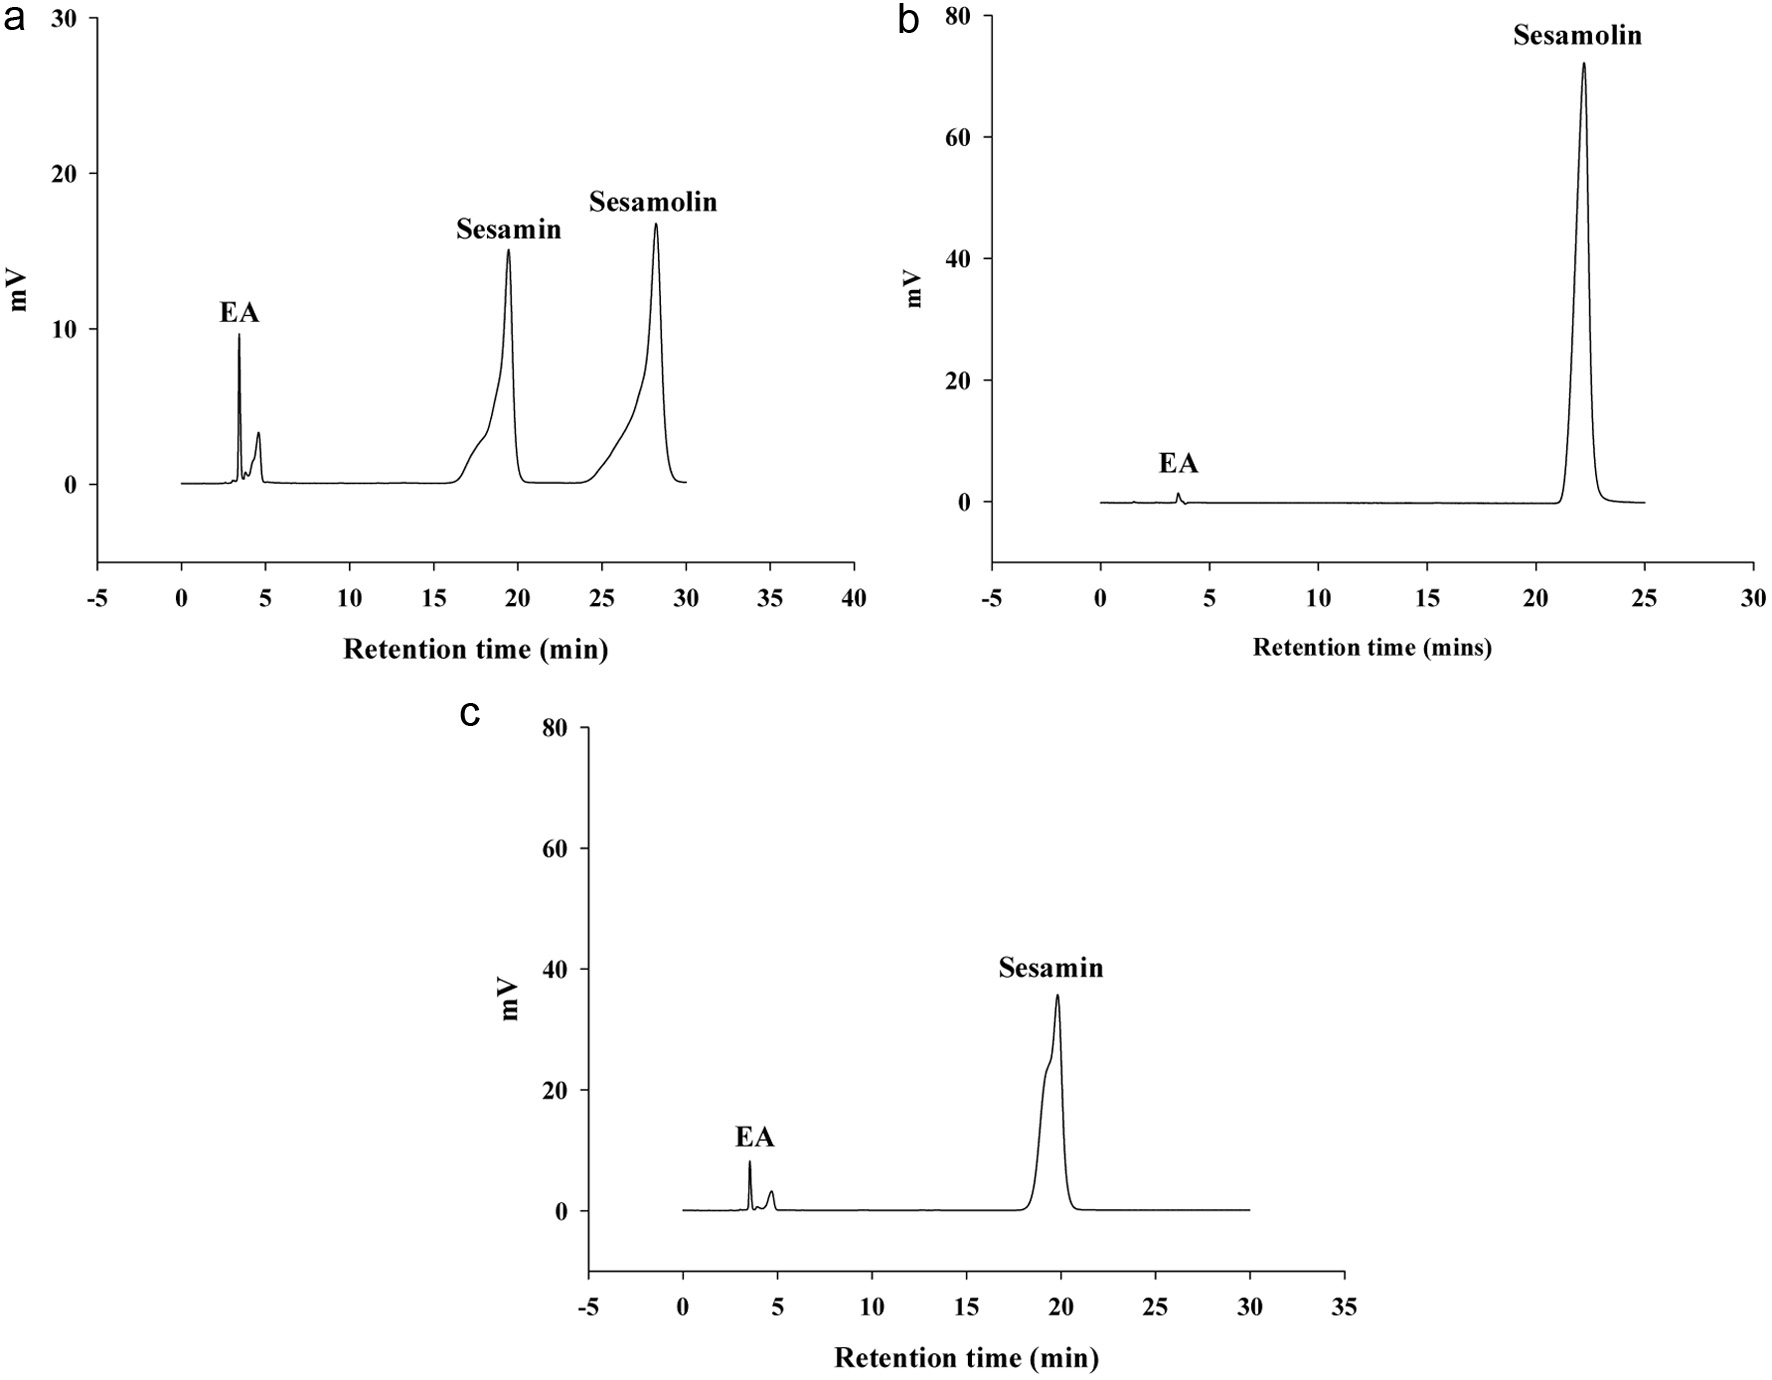
Figure 1. Preparation of sesamolin and sesamin samples. (a) The HPLC chromatogram for the initial obtained sesame lignan samples, which was prepared in ethyl acetate (EA) with a concentration of 0.35 mg/mL in the sample. (b) The HPLC chromatogram of the purified sesamolin sample by using the preparative HPLC, which was prepared in EA with a concentration of 1 mM sesamolin. (c) The HPLC chromatogram of the purified sesamin sample by using the preparative HPLC, which was prepared in EA with a concentration of 1 mM sesamolin.
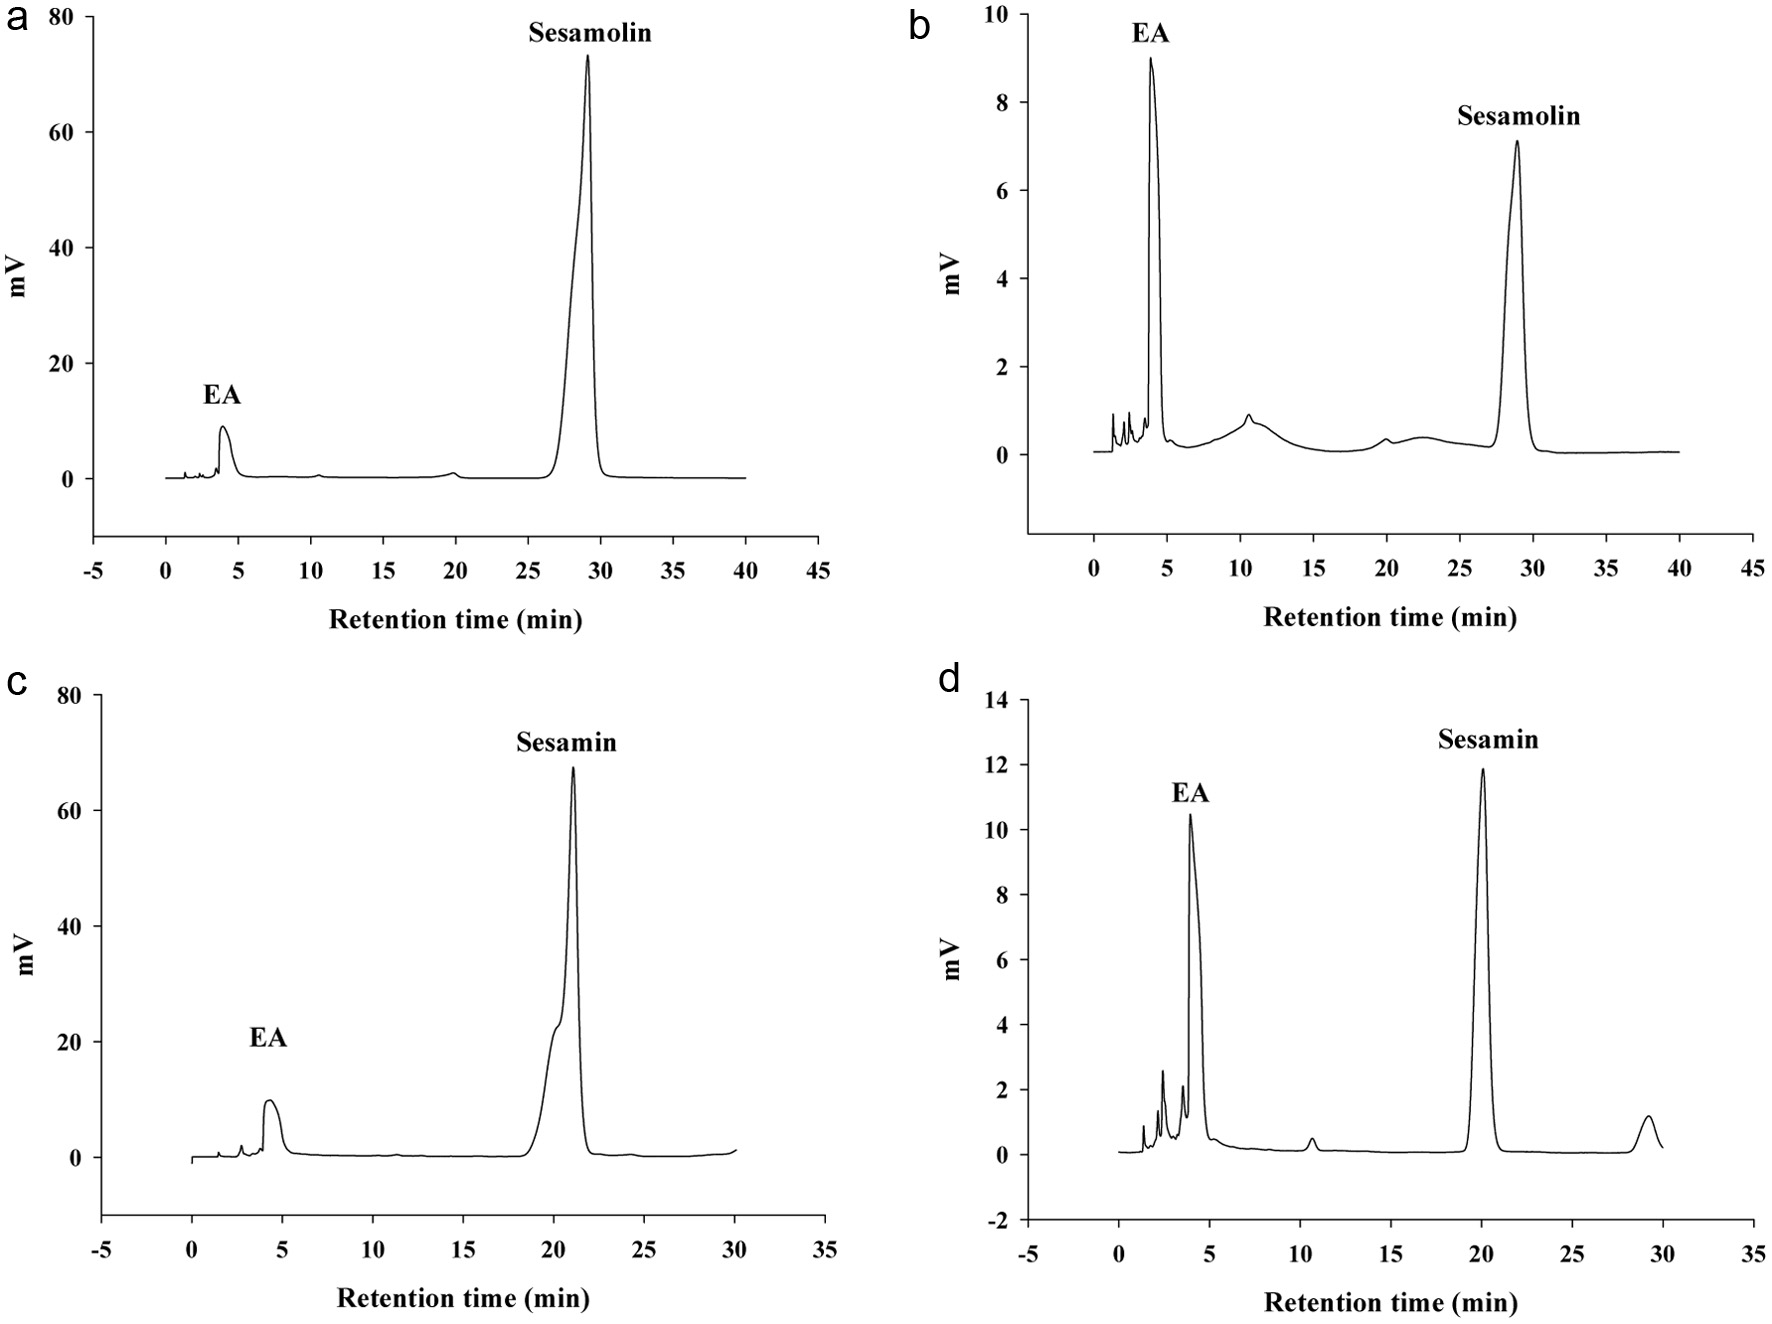
Figure 2. Efficiency evaluation of the preparation of the γ-cyclodextrin (γ-CD) and sesamolin or sesamin inclusion complexes. (a) The HPLC chromatogram of sesamolin in a pure water sample containing the original concentration of sesamolin, which was then extracted by ethyl acetate (EA). The extract (1 mL) was evaporated, reconstituted, and analyzed by HPLC, as described in the Methods. (b) The HPLC chromatogram of sesamolin after mixing with the γ-CD for 12-24 hours, followed by centrifugation and the same procedures as described in the Methods. (c) The original HPLC chromatogram of sesamin, as described in the Methods. (d) The HPLC chromatogram of sesamin after mixing and centrifugation, following the same procedures as described in the Methods.
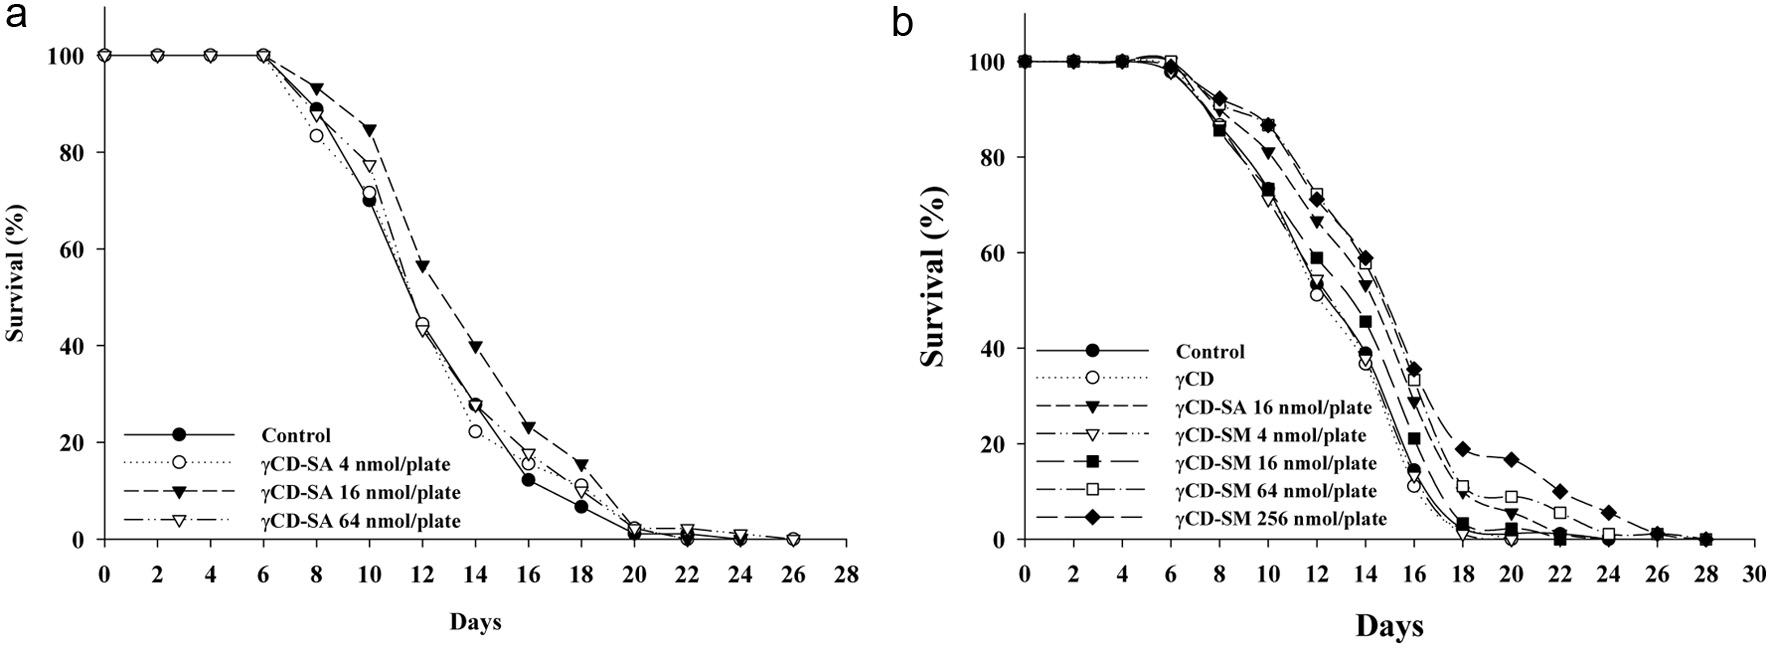
Figure 3. Effects of sesamolin and sesamin on the lifespan of the wild-type C. elegans. The γ-CD and sesamolin or sesamin inclusion complexes (i.e., γCD-SM and γCD-SA) were prepared and the lifespan assay were conducted with (a) the γCD-SM contained the doses of sesamolin from 0, 4, 16, 64 nmol/plate, or (b) the γCD-SA contained the doses of sesamolin from 0, 4, 16, 64 to 256 nmol/plate. The method for the lifespan assay performed as described in Methods (n = 90).
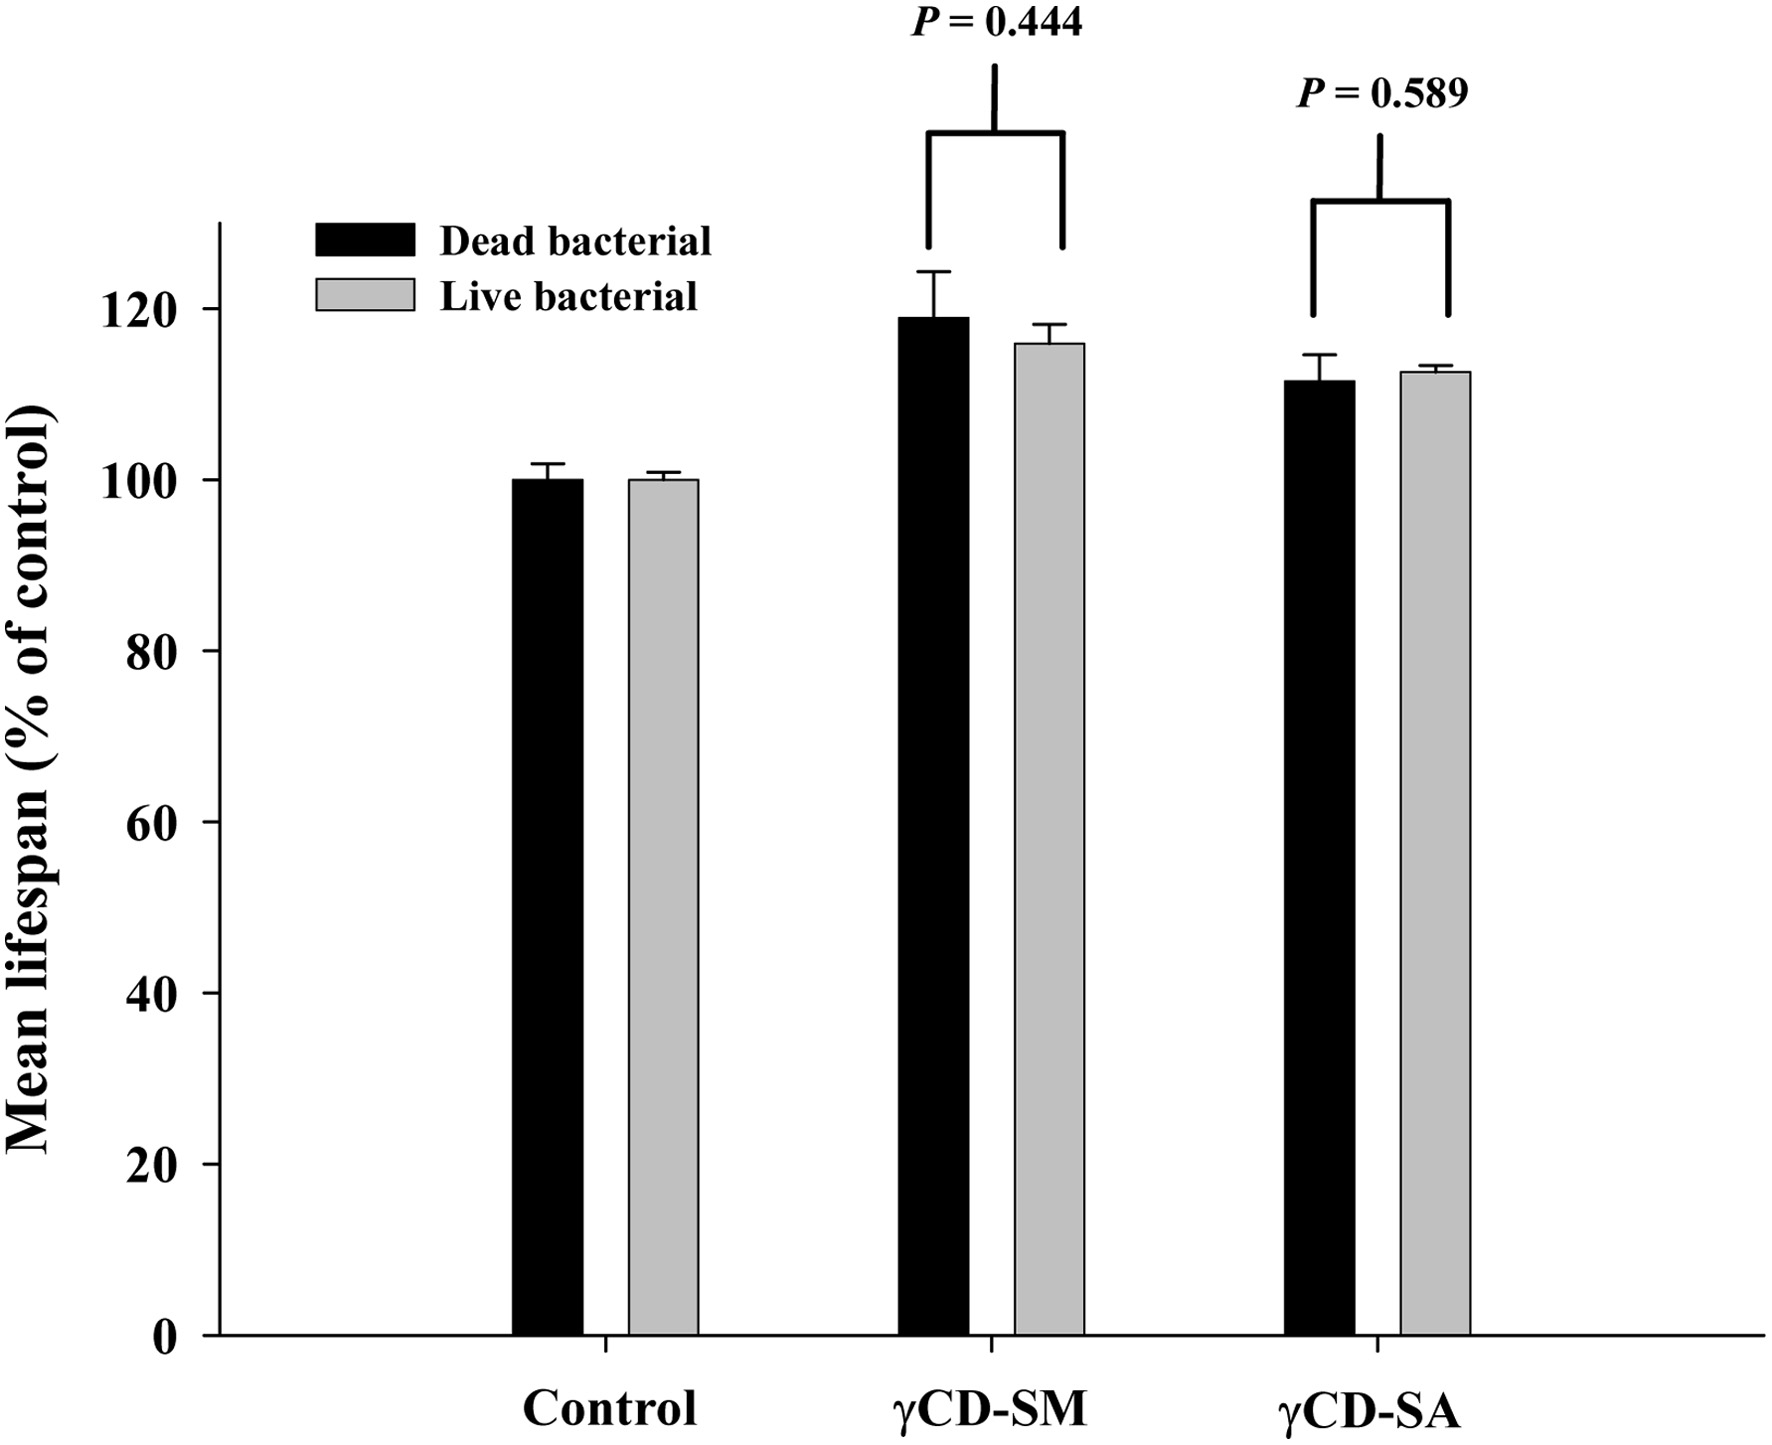
Figure 4. Effects of sesamolin and sesamin on the lifespan of the wild-type C. elegans under the dead bacterial or live bacterial culture. The γ-CD and sesamolin or sesamin inclusion complexes (i.e., γCD-SM and γCD-SA) were prepared. The obtained mean lifespan presented as a percentage increase in the mean lifespan as compared to the control from the lifespan assay under the dead bacterial and live bacterial culture. The data are from three independent lifespan assays, with n = 90 in each group. P values are indicated in the figures.
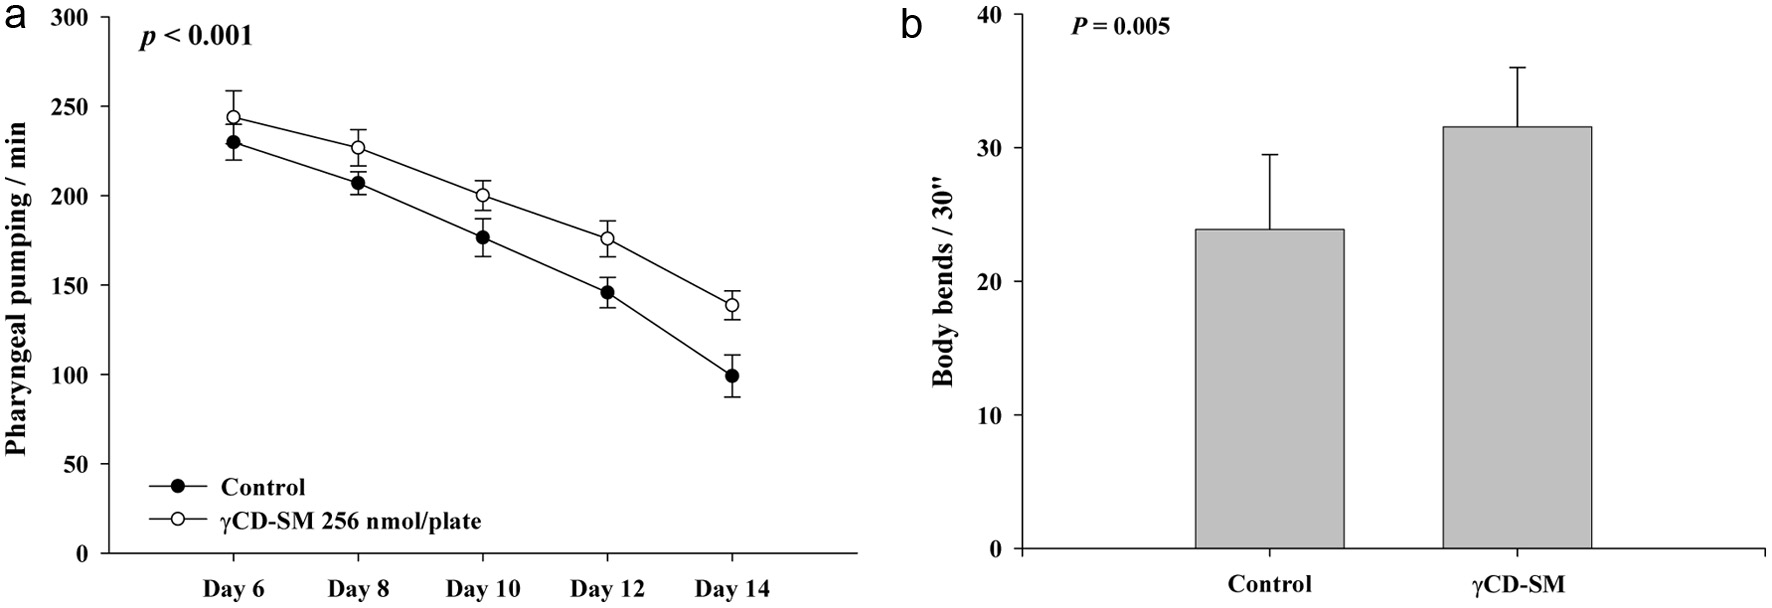
Figure 5. Effects of sesamolin on the health indexes of the wild-type C. elegans. For health indexes analysis, the nematodes were grown on plates containing with or without 256 nmol/plate of sesamolin administrated by the prepared γCD-SM. (a) The pharyngeal pumping and (b) the body bends were determined (n = 10) as described in Methods. P values are as shown in the figures.
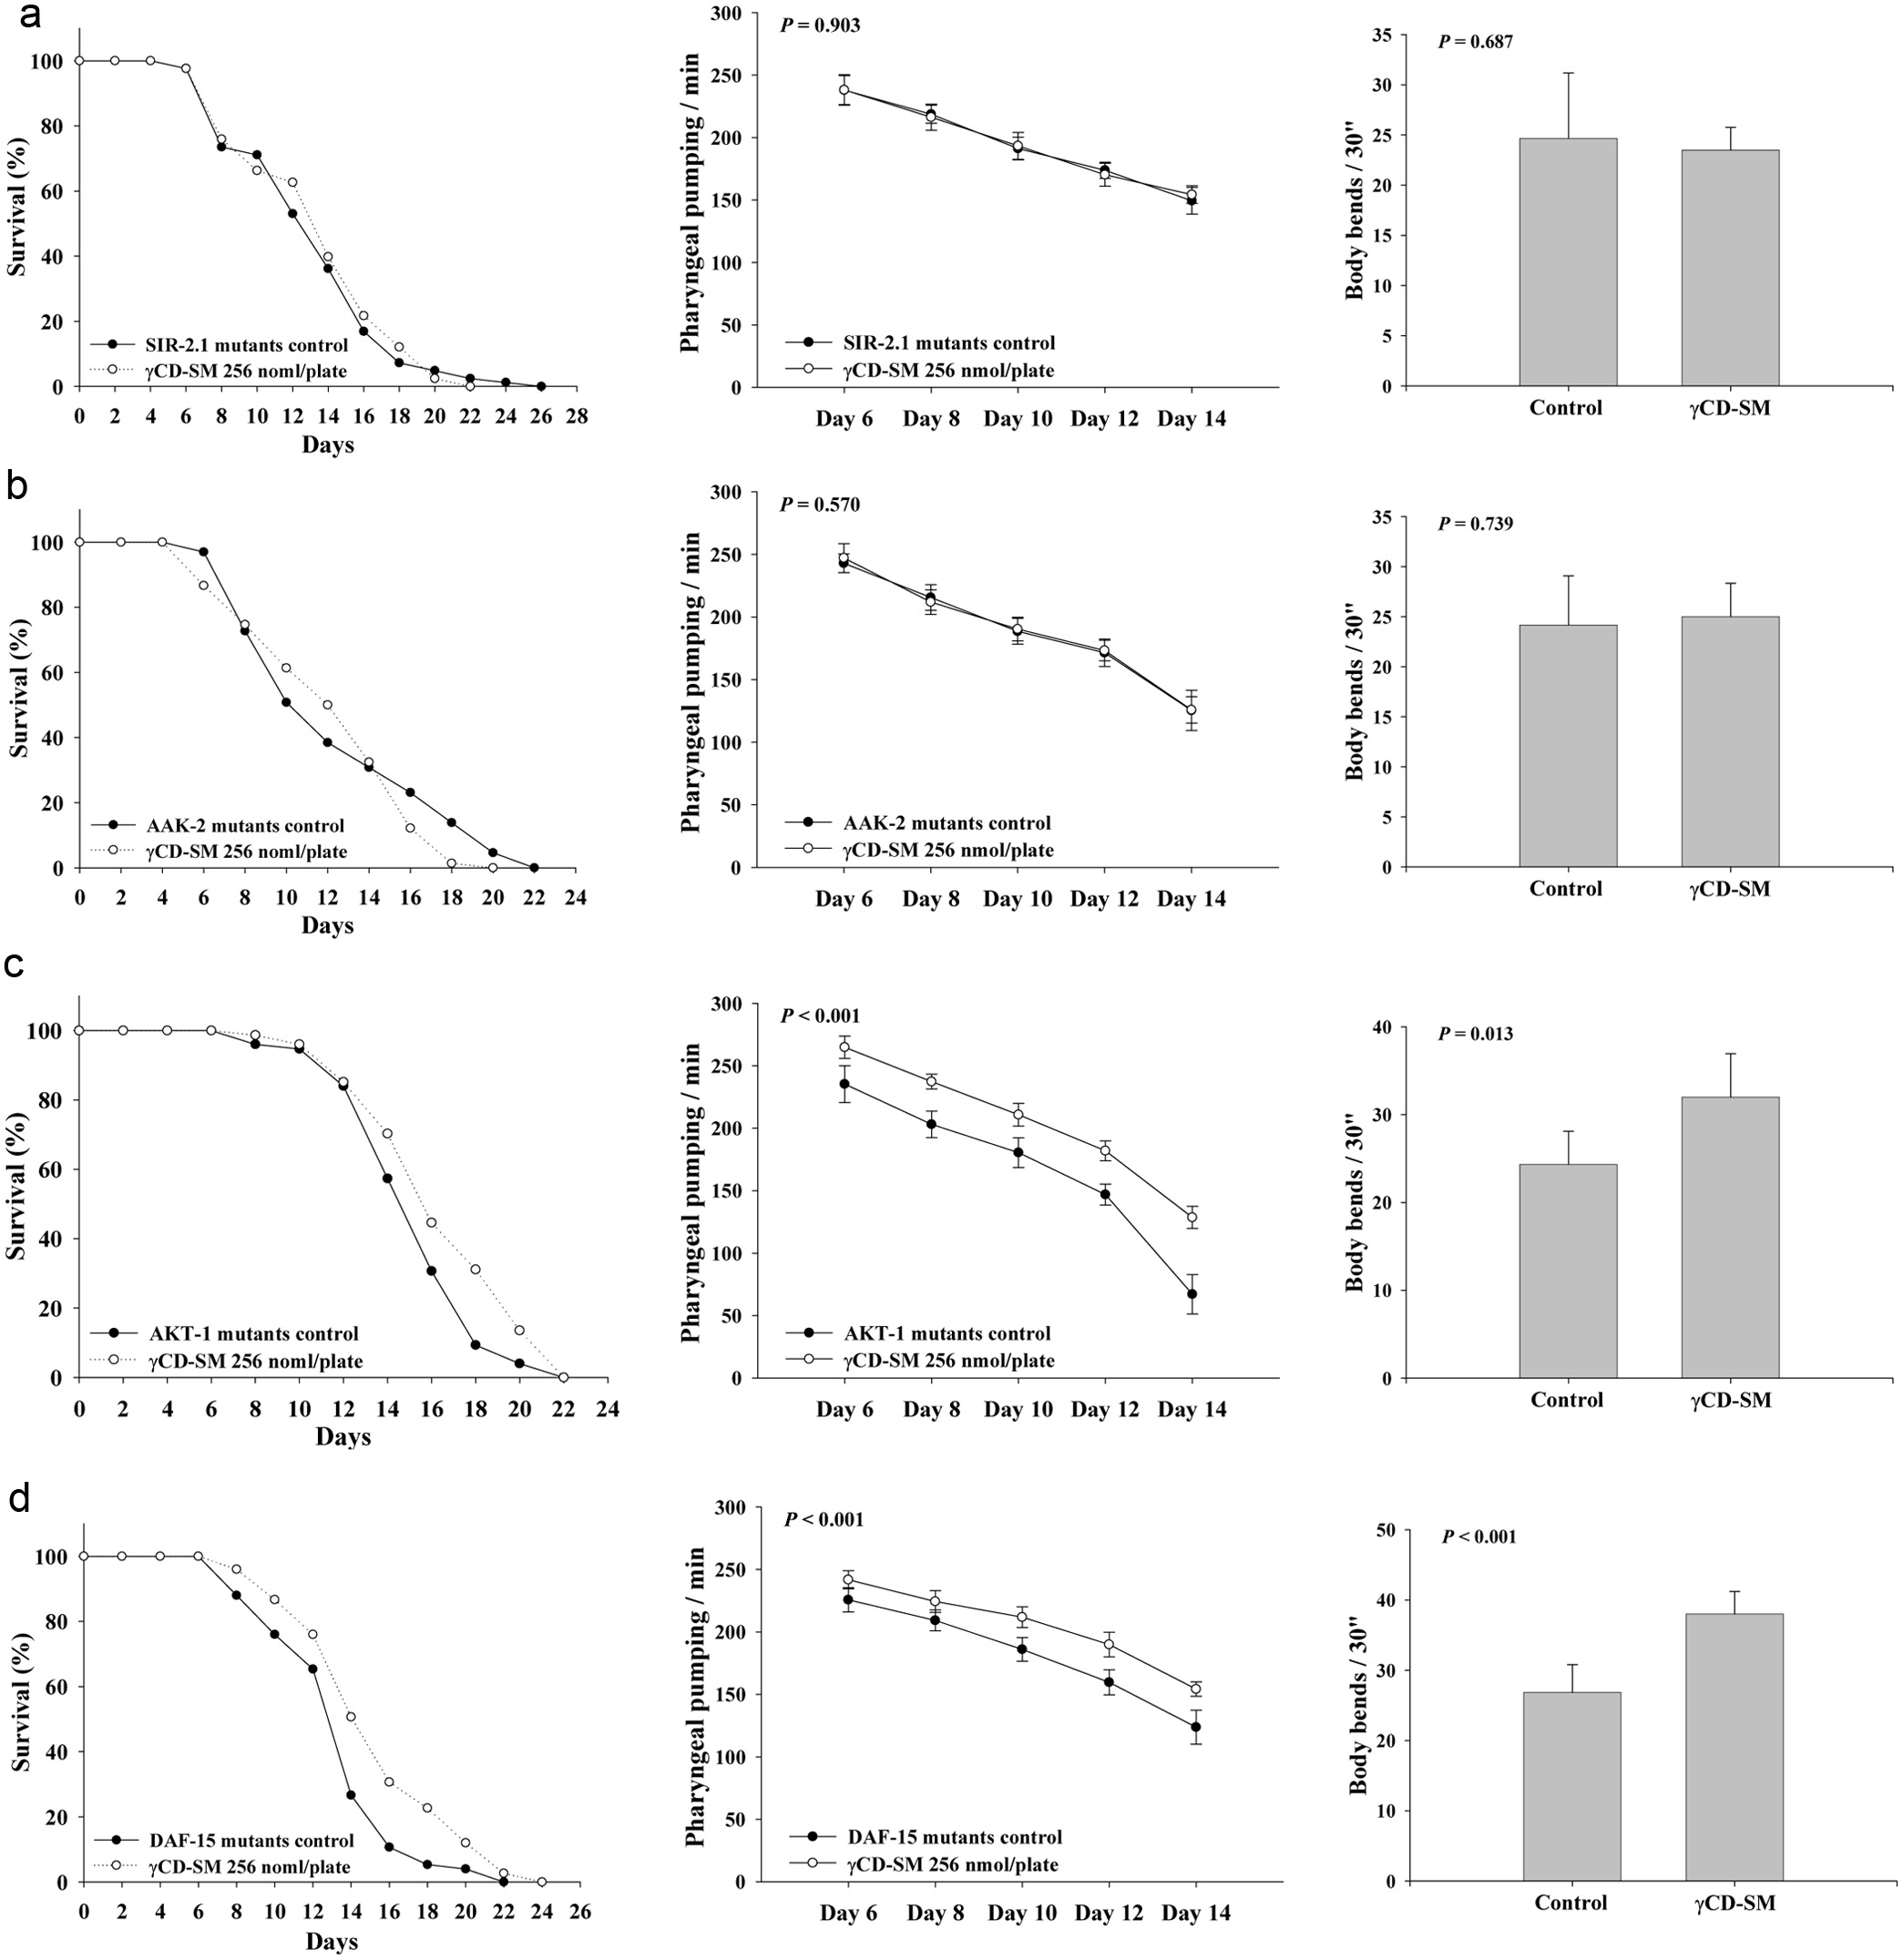
Figure 6. Effects of the sesamolin on the lifespan and health indexes of the SIR-2.1, AAK-2, AKT-1 and DAF-15 mutants. For the loss-of-function tests in the lifespan assay, the (a) SIR-2.1, (b) AAK-2, (c)AKT-1, and (d) DAF-15 mutants were grown on plates with or without 256 nmol/plate of sesamolin administrated by the prepared γCD-SM (n = 90) as described in Methods. For the loss-of-function tests in the health indexes analysis, the nematodes were grown on plates containing with or without 256 nmol/plate of sesamolin administrated by the prepared γCD-SM. The pharyngeal pumping and the body bends were determined (n = 10) as described in Methods. P values are as shown in the figures.
Tables
Table 1. Analysis of the preparation efficiency of the γ-CD and sesamolin or sesamin inclusion complexes
| Samples | Lignan concentration in 100 μL EA, the reconstitutions (mΜ) | Lignan content in the EA extracts (%)# |
|---|
| #The total amount of sesamolin or sesamin extracted by three rounds of 5 mL ethyl acetate (EA), expressed as a percentage, and the lignan content in the EA extracts after centrifugation, compared to the original. |
| Sesamolin | Original | 2.22 ± 0.12 | 100 ± 5.55 |
| After centrifugation | 0.16 ± 0.01 | 7.2 ± 0.51 |
| Sesamin | Original | 2.04 ± 0.11 | 100 ± 5.30 |
| After centrifugation | 0.15 ± 0.02 | 7.4 ± 1.14 |
Table 2. Effects of sesamin and sesamolin on the lifespan of wild-type C. elegans.
| Mean lifespan (Day) | Median lifespan (Day) | Maximum lifespan (Day) | P value## |
|---|
| #Sesamolin or sesamin was included in the γ-clodextrin to prepare the γCD-SM or γCD-SA. In the table, the γCD-SA 4 nmol/plate means that the inclusion complex contained 4 nmol of sesamin, and administrated for the C. elegans, vis versa. ##P values were obtained when compared to the control group by the Cox regression model. Values of the mean lifespan (n = 90 for each group) are expressed as mean ± SD. |
| Sesamin | | | | |
| Control | 13.0 ± 3.4 | 12 | 24 | |
| γCD-SA 4 nmol/plate# | 13.0 ± 3.7 | 12 | 22 | 0.896 |
| γCD-SA 16 nmol/plate | 14.7 ± 3.7 | 14 | 22 | 0.022* |
| γCD-SA 64 nmol/plate | 13.8 ± 3.3 | 12 | 26 | 0.278 |
| Sesamolin | | | | |
| Control | 13.4 ± 3.5 | 14 | 24 | |
| γCD | 13.2 ± 3.3 | 14 | 20 | 0.636 |
| γCD-SA 16 nmol/plate | 14.7 ± 3.8 | 16 | 24 | 0.043* |
| γCD-SM 4 nmol/plate | 13.2 ± 3.4 | 14 | 20 | 0.764 |
| γCD-SM 16 nmol/plate | 13.8 ± 3.7 | 14 | 22 | 0.444 |
| γCD-SM 64 nmol/plate | 15.4 ± 4.1 | 16 | 28 | 0.003* |
| γCD-SM 256 nmol/plate | 15.9 ± 4.8 | 16 | 28 | <0.001* |


