Figures

Figure 1. CAA of Caco-2 BBe1 cell treated with 0.1, 0.2, 0.5 and 1.0 g HE/mL of the phenolic extracts of alfalfa, buckwheat, clover, and orange honeys (a), and 1 mM of major phenolic compounds in honeys (b). Value are expressed as CAA Unit (%) and presented as mean ± SD, n = 3. Shared letters indicate no significant difference (p < 0.05).
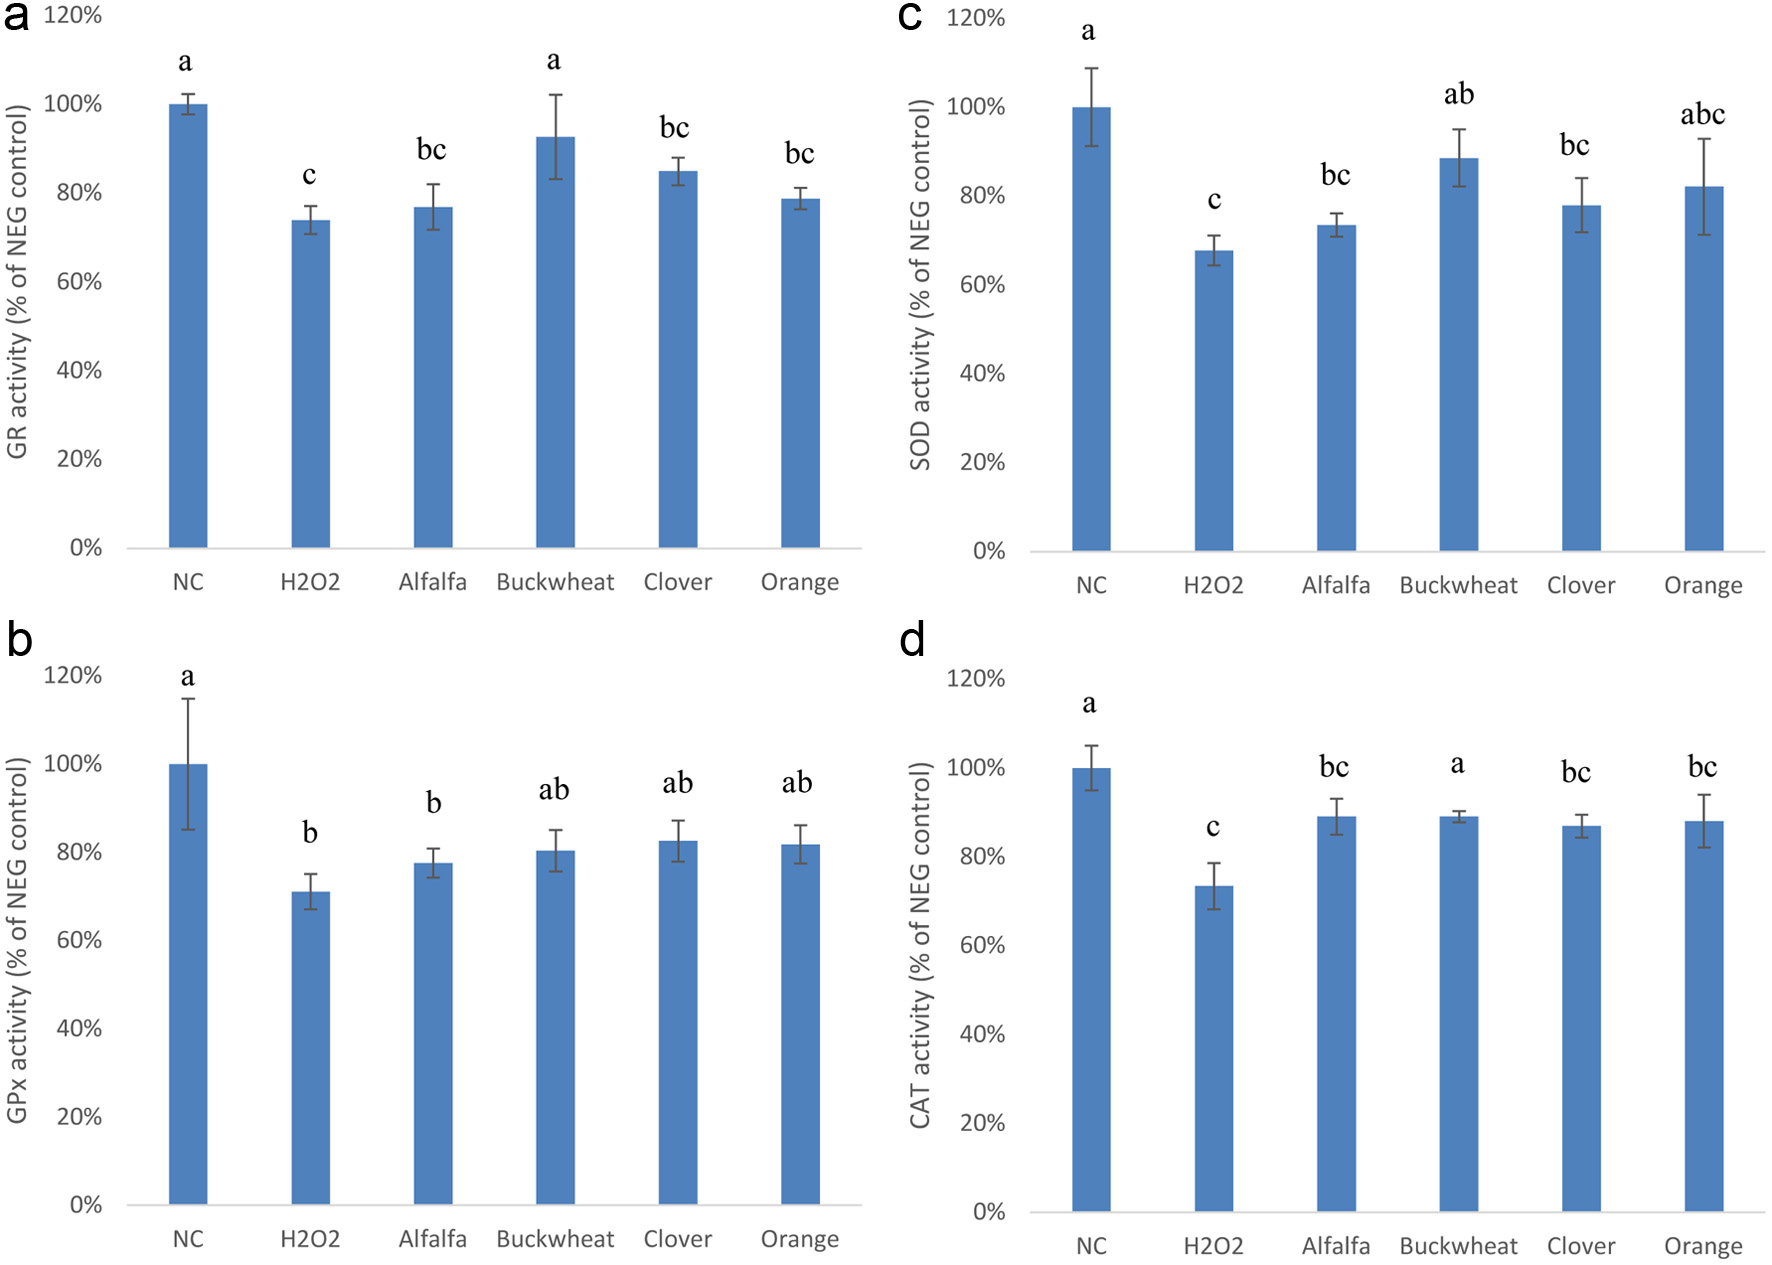
Figure 2. Effect of the phenolic extracts of alfalfa, buckwheat, clover, and orange honeys on endogenous antioxidant enzyme activities (a: GR; b:GPx; c: SOD; d: CAT) in H2O2-stimulated Caco-2 BBe1 cells. The negative control (NC) represents untreated cells. Positive control (H2O2) represents cells treated with H2O2 only. Values are presented as mean ± SD, n = 3. Shared letters indicate no significant difference (p < 0.05).
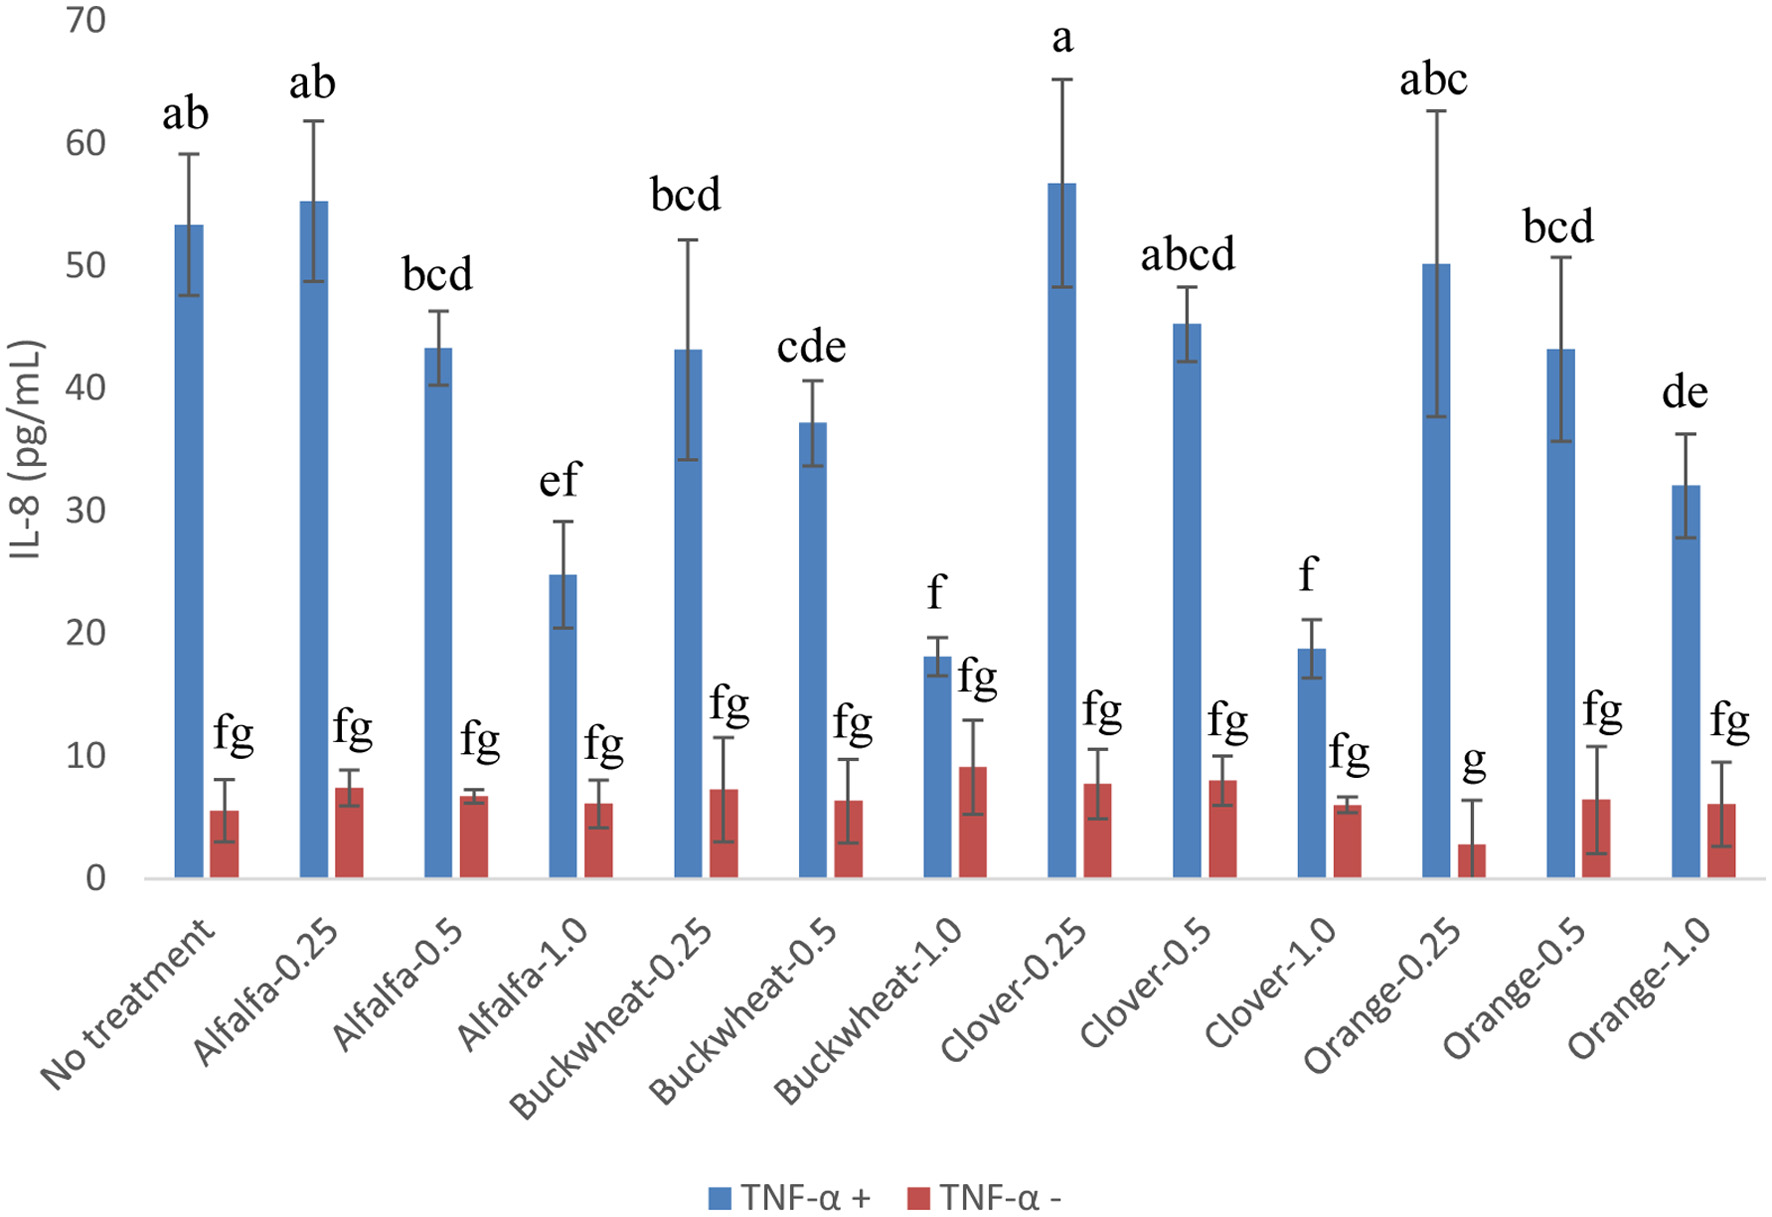
Figure 3. Released IL-8 of Caco-2 BBe1 cell treated with 2 ng/mL of TNF-α in combination with 0.25, 0.5 and 1.0 g HE/mL of the phenolic extracts of alfalfa, buckwheat, clover, and orange honeys. Value are expressed as IL-8 concentration and presented as mean ± SD, n = 4. Shared letters indicate no significant difference (p < 0.05).
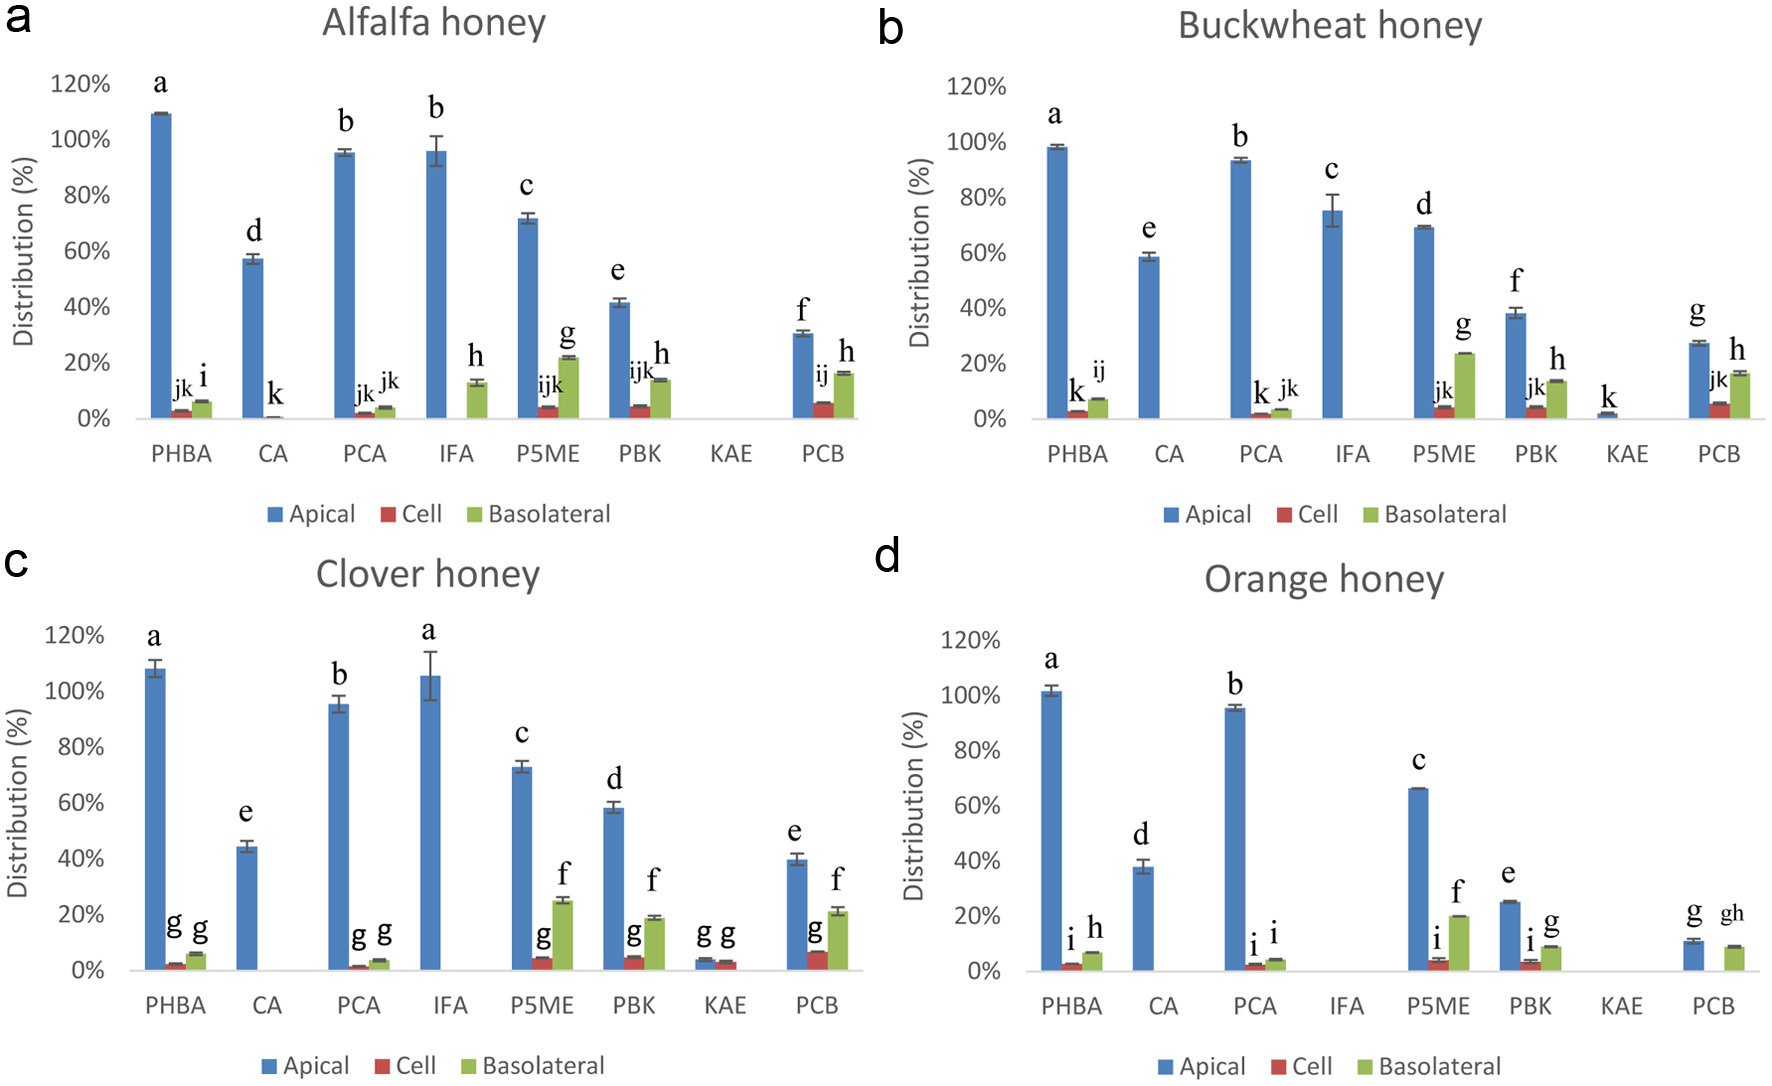
Figure 4. Apical, basal, and Caco-2 BBe1 cell uptake fractions of major phenolic compounds in the extract from alfalfa (a), buckwheat (b), clover (c), and orange honeys (d) after 6 h incubation. The percentage was determined by the ratio of the concentration of each compartment to the original extract (1.0 g HE/mL). Values are presented as mean ± SD, n = 3. Shared letters indicate no significant difference (p < 0.05).
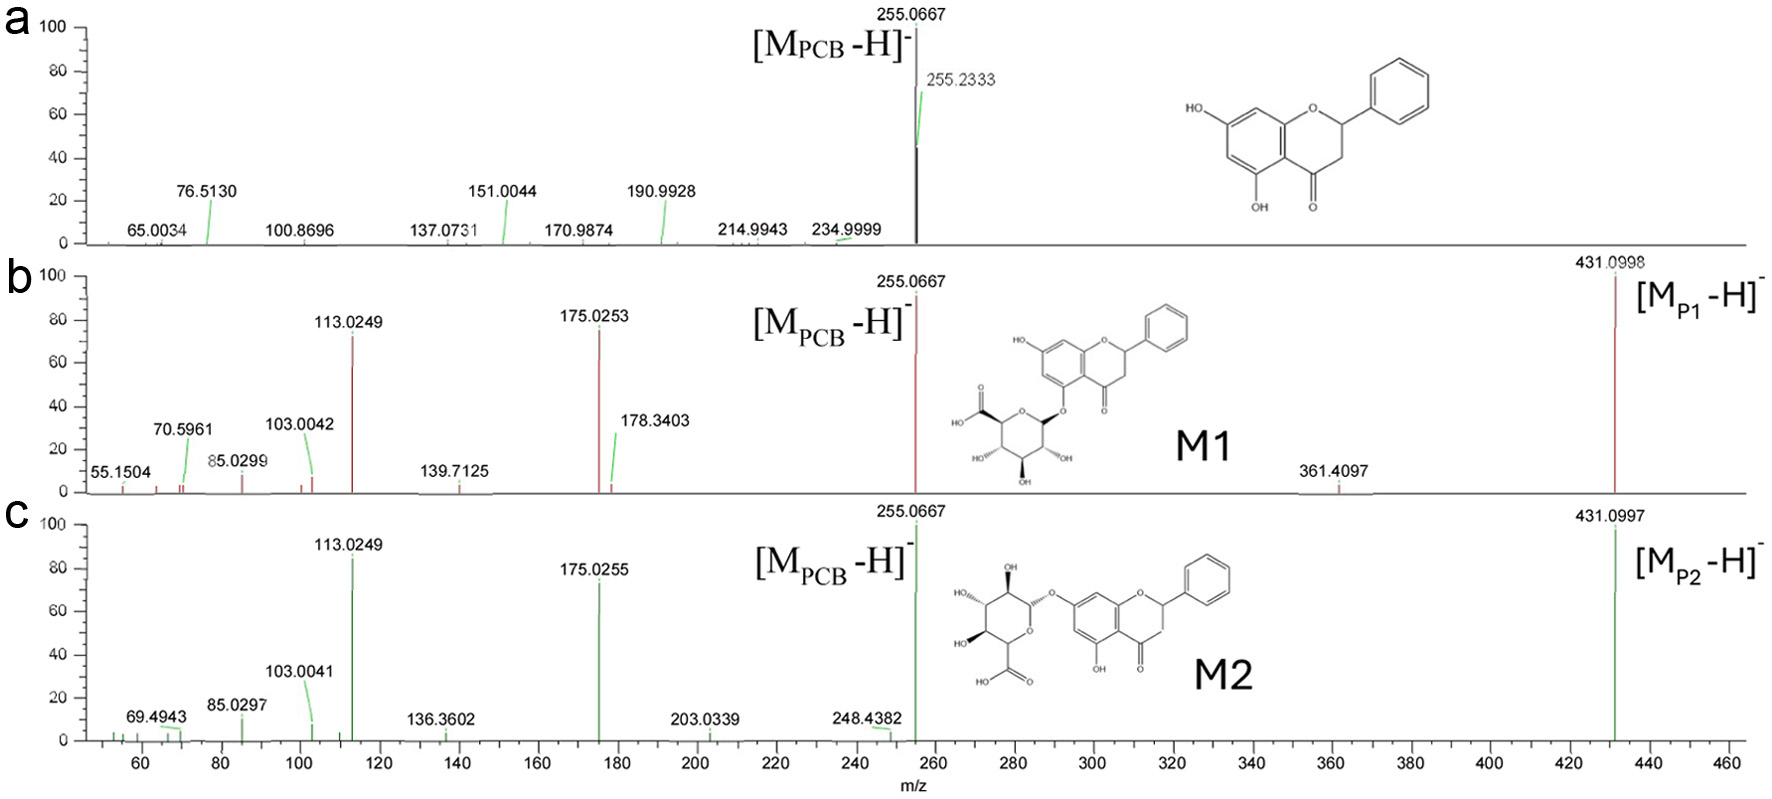
Figure 5. MS/MS spectra of PCB (a) and its metabolites (P1, b; P2, c) extracted from basolateral side of Caco-2 BBe1 cells after 6 h incubation.
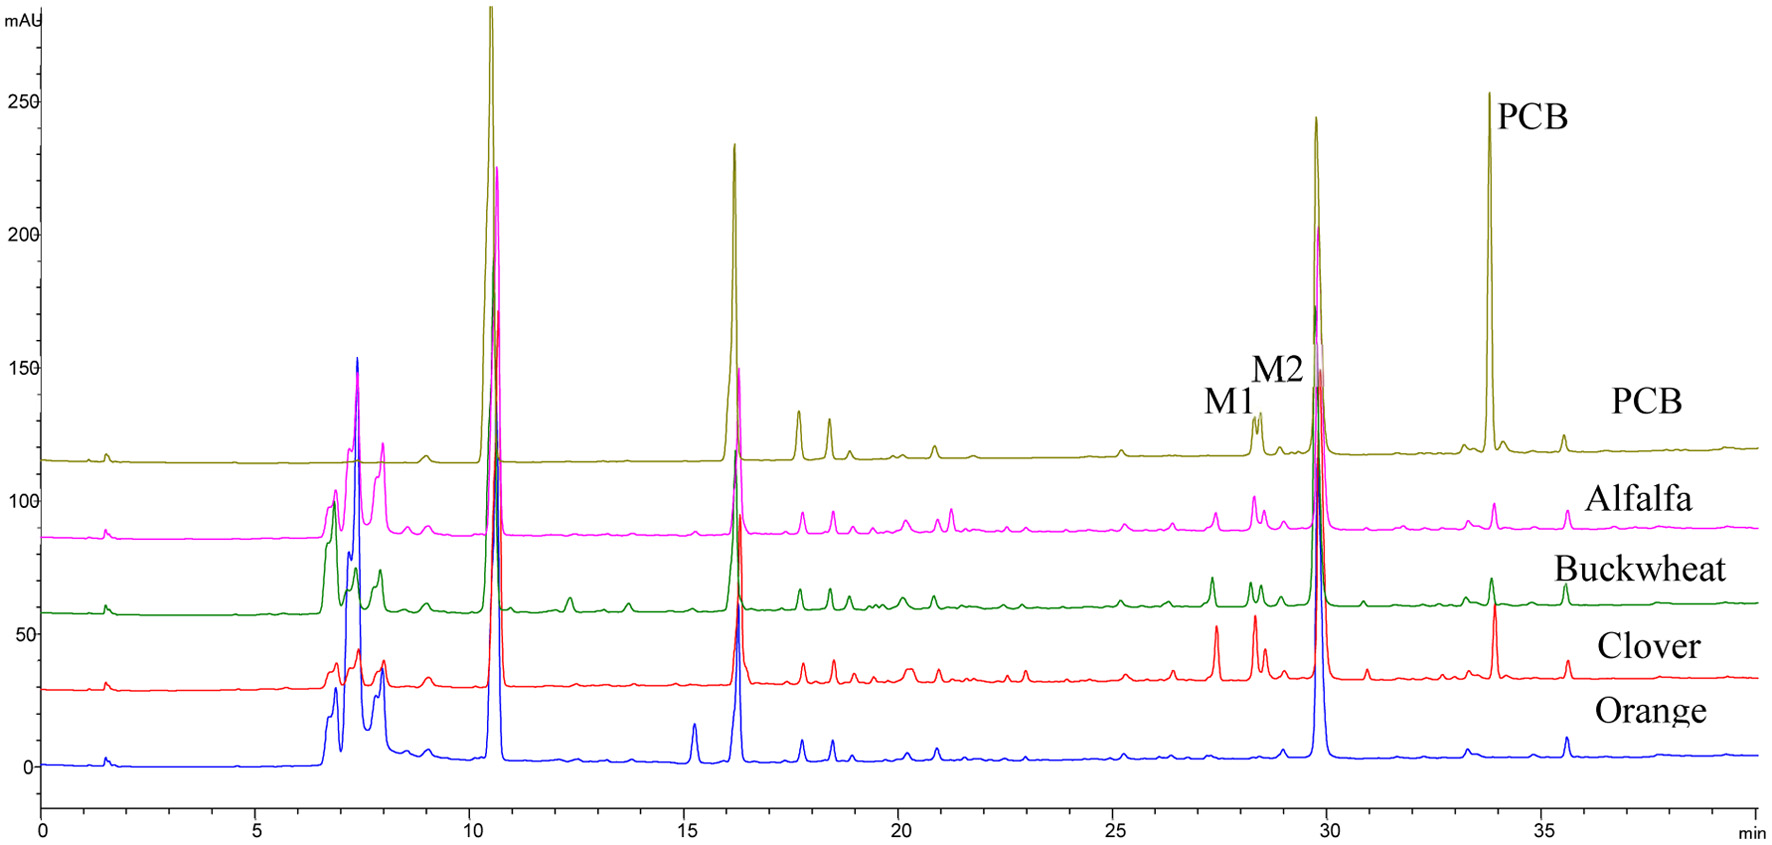
Figure 6. HPLC chromatograms of phenolic compounds extracted from basolateral side of Caco-2 BBe1 cells after 6 h incubation with 100 μM PCB, 1 g HE/mL alfalfa, buckwheat, clover, and orange honey extracts.
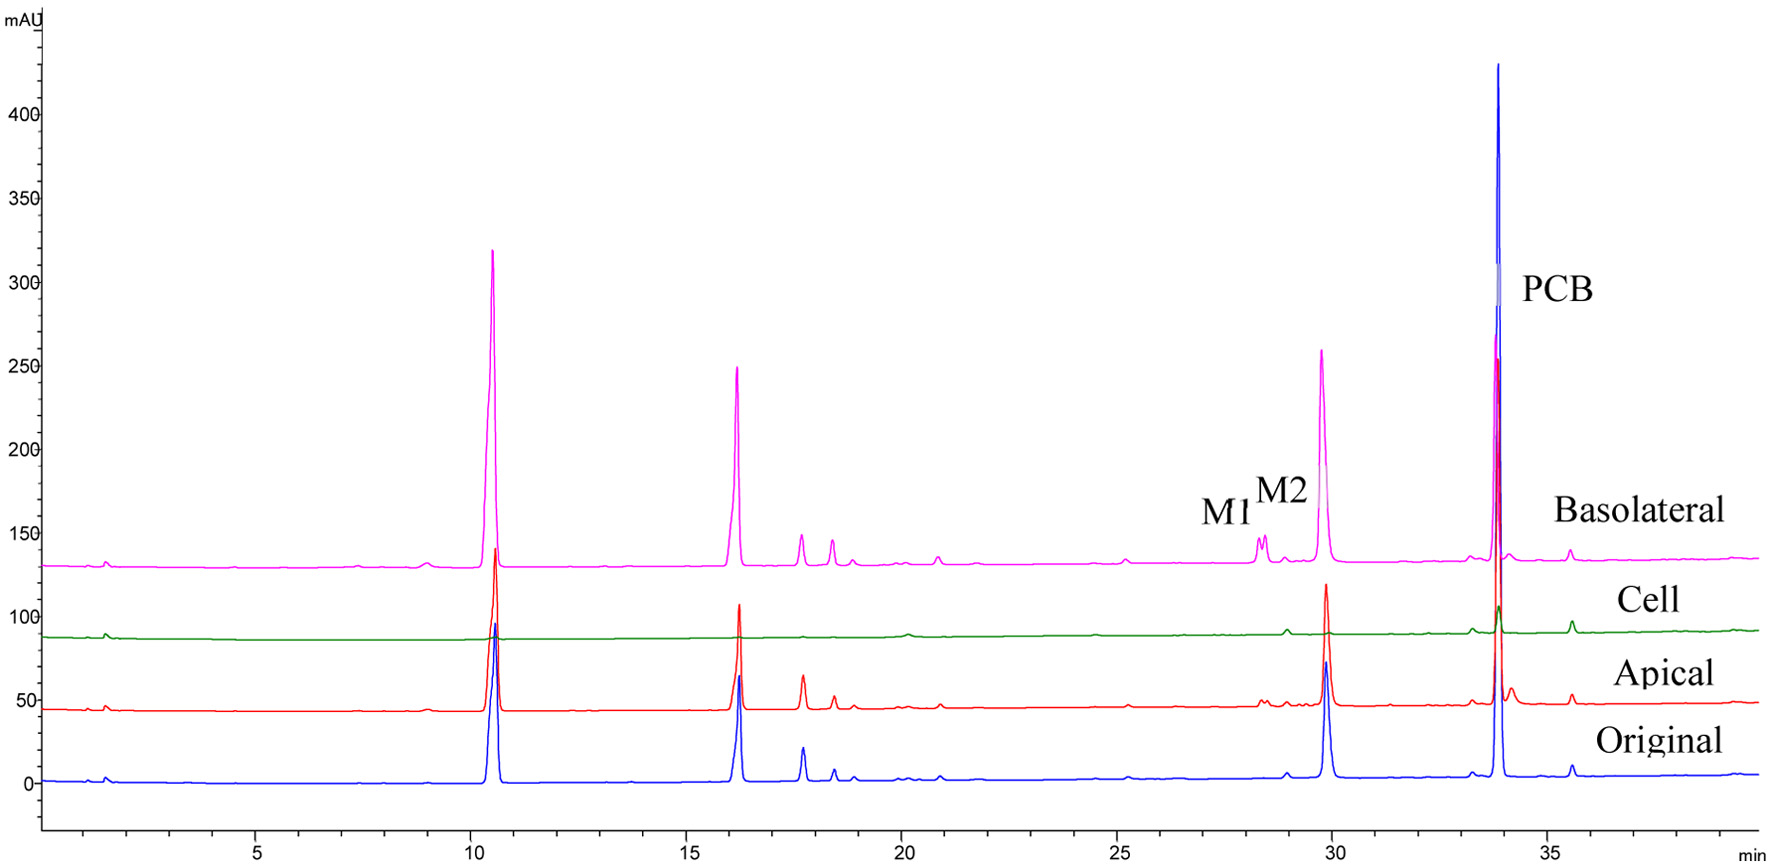
Figure 7. HPLC chromatograms of PCB and its metabolites P1 and P2 extracted from basolateral, apical, cells of Caco-2 BBe1 cells after 6 h incubation with 100 μM PCB.
Tables
Table 1. Antioxidant activities of honey extracts and their major phenolic compounds
| Mean ± SD (n = 3) |
|---|
| Means followed by a common letter within the same column (honey extracts or phenolic compounds) are not significantly different by the Tukey’s HSD test at the 5% level of significance. |
| Honey extracts | FRAP (µmol AAE/g honey) | DPPH (µmol TE/g honey) | ORAC (µmol TE/g honey) |
| Alfalfa | 0.709 ± 0.012d | 0.365 ± 0.007c | 1.651 ± 0.052c |
| Buckwheat | 1.781 ± 0.018a | 0.918 ± 0.009a | 3.377 ± 0.112a |
| Clover | 0.809 ± 0.001c | 0.401 ± 0.028c | 2.500 ± 0.030b |
| Orange | 0.954 ± 0.042b | 0.583 ± 0.013b | 1.484 ± 0.122c |
| Mean ± SD (n = 3) |
|---|
| Means followed by a common letter within the same column (honey extracts or phenolic compounds) are not significantly different by the Tukey’s HSD test at the 5% level of significance. |
| Phenolic compounds (PCs) | FRAP (µmol AAE/µmol PC) | DPPH (µmol TE/µmol PC) | ORAC (µmol TE/µmol PC) |
| p-Hydroxybenzoic acid | <0.050 | <0.125 | 7.274 ± 0.232b |
| Caffeic acid | 3.382 ± 0.075a | 1.049 ± 0.039a | 7.356 ± 0.688b |
| p-Coumaric acid | 0.480 ± 0.043d | 0.269 ± 0.060d | 5.609 ± 0.192c |
| Isoferulic acid | 1.560 ± 0.063c | 0.395 ± 0.032c | 6.339 ± 0.363bc |
| Pinobanksin-5-methyl ether | <0.050 | <0.125 | 4.070 ± 0.117d |
| Pinobanksin | <0.050 | <0.125 | 3.257 ± 0.493d |
| Kaempferol | 2.643 ± 0.027b | 0.868 ± 0.033b | 11.303 ± 0.226a |
| Pinocembrin | <0.050 | <0.125 | 3.549 ± 0.359d |
Table 2. Bioaccessibility of major phenolic compounds in honeys through in vitro digestion
| Relative bioaccessibility (%), Mean ± SD, n = 3 |
|---|
| Alfalfa | Buckwheat | Clover | Orange |
|---|
| Means followed by a star symbol (*) indicate a significantly difference between before and after in vitro digestion by the Tukey’s HSD test at the 5% level of significance. P5ME, Pinobanksin-5-methyl ether |
| p-Hydroxybenzoic acid | 111.3% ± 2.3%* | 96.7% ± 4.5% | 106.5% ± 3.9% | 97.2% ± 1.7% |
| Caffeic acid | 79.9% ± 2.3%* | 86.8% ± 4.0%* | 89.5% ± 7.9% | 78.4% ± 1.5%* |
| p-Coumaric acid | 93.2% ± 3.7% | 92.1% ± 4.4% | 95.5% ± 5.9% | 91.6% ± 1.2%* |
| Isoferulic acid | 103.1% ± 3.1% | 84.5% ± 17.9% | 111.8% ± 15.0% | 89.5% ± 17.7% |
| P5ME | 94.8% ± 0.5%* | 94.4% ± 1.9%* | 100.2% ± 5.0% | 89.9% ± 6.0% |
| Pinobanksin | 88.0% ± 0.8%* | 83.3% ± 2.9%* | 96.4% ± 3.3% | 78.9% ± 1.4%* |
| Kaempferol | 40.5% ± 2.7%* | 48.5% ± 2.4%* | 49.6% ± 4.1%* | 40.9% ± 4.1%* |
| Pinocembrin | 87.5% ± 2.4%* | 84.4% ± 1.1%* | 95.8% ± 4.6% | 80.6% ± 0.9%* |


