Figures
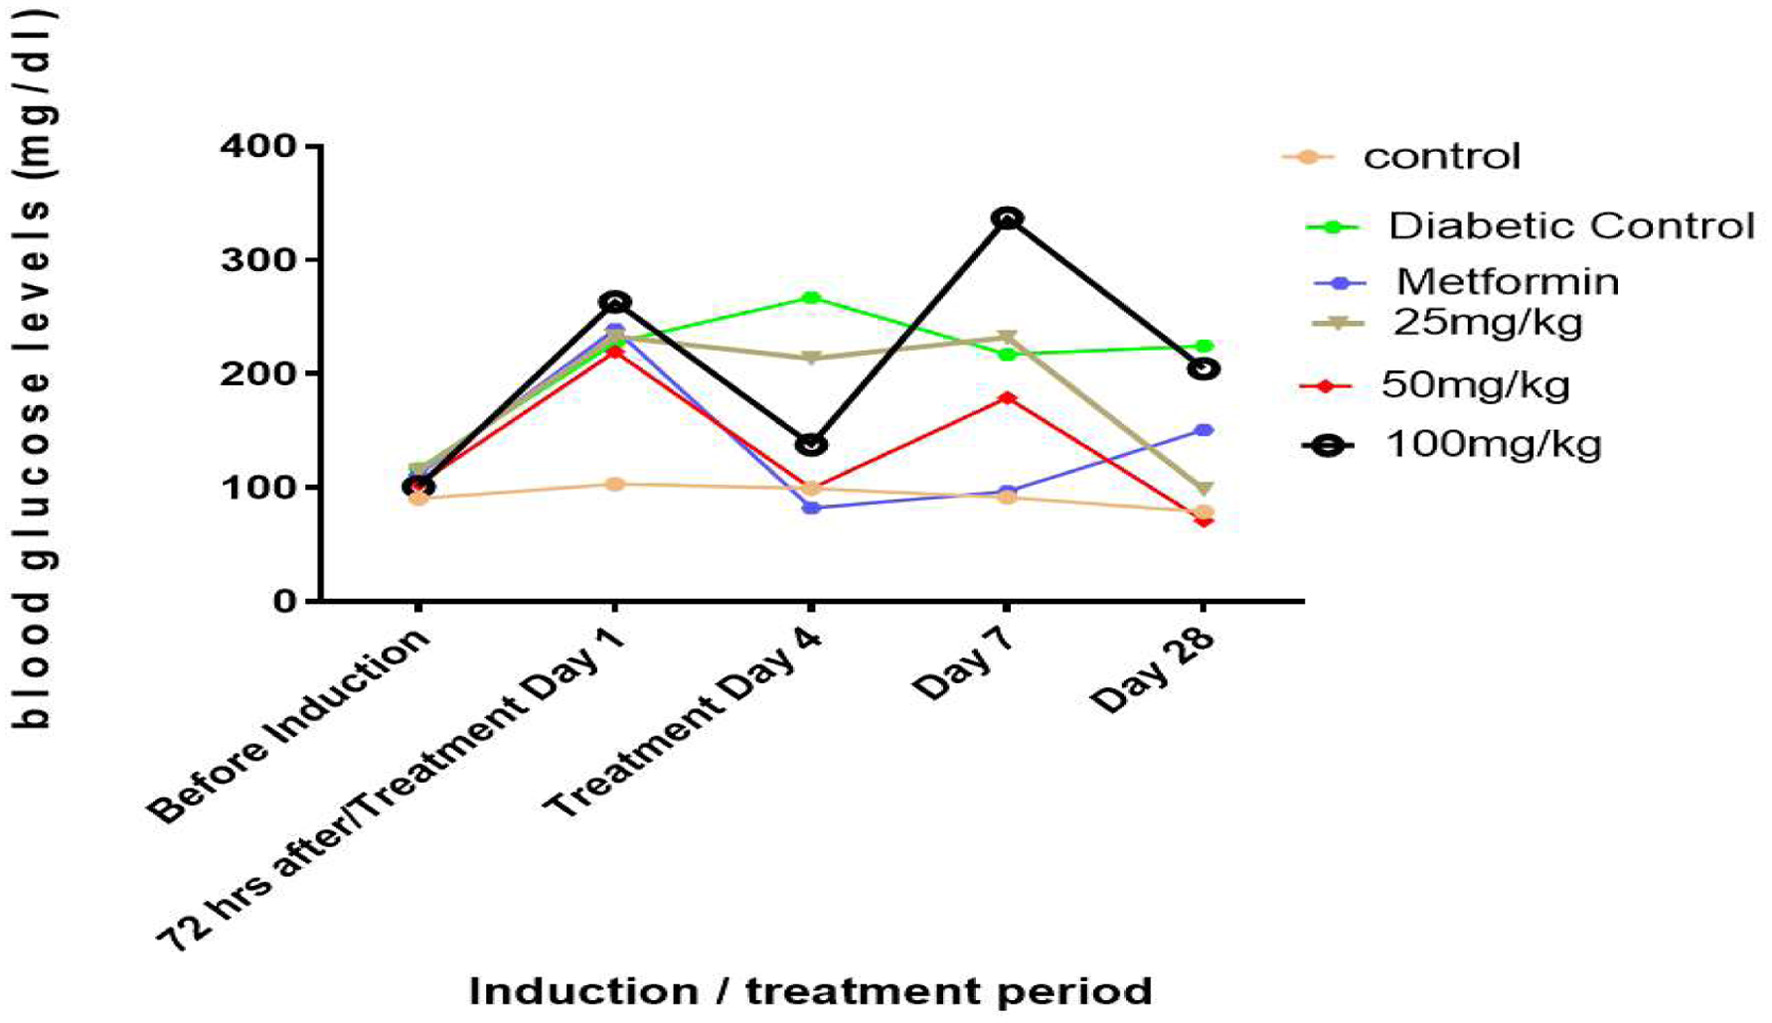
Figure 1. Line graphs showing the hypoglycemic effect of rutin on blood glucose levels in STZ-induced diabetic rats.
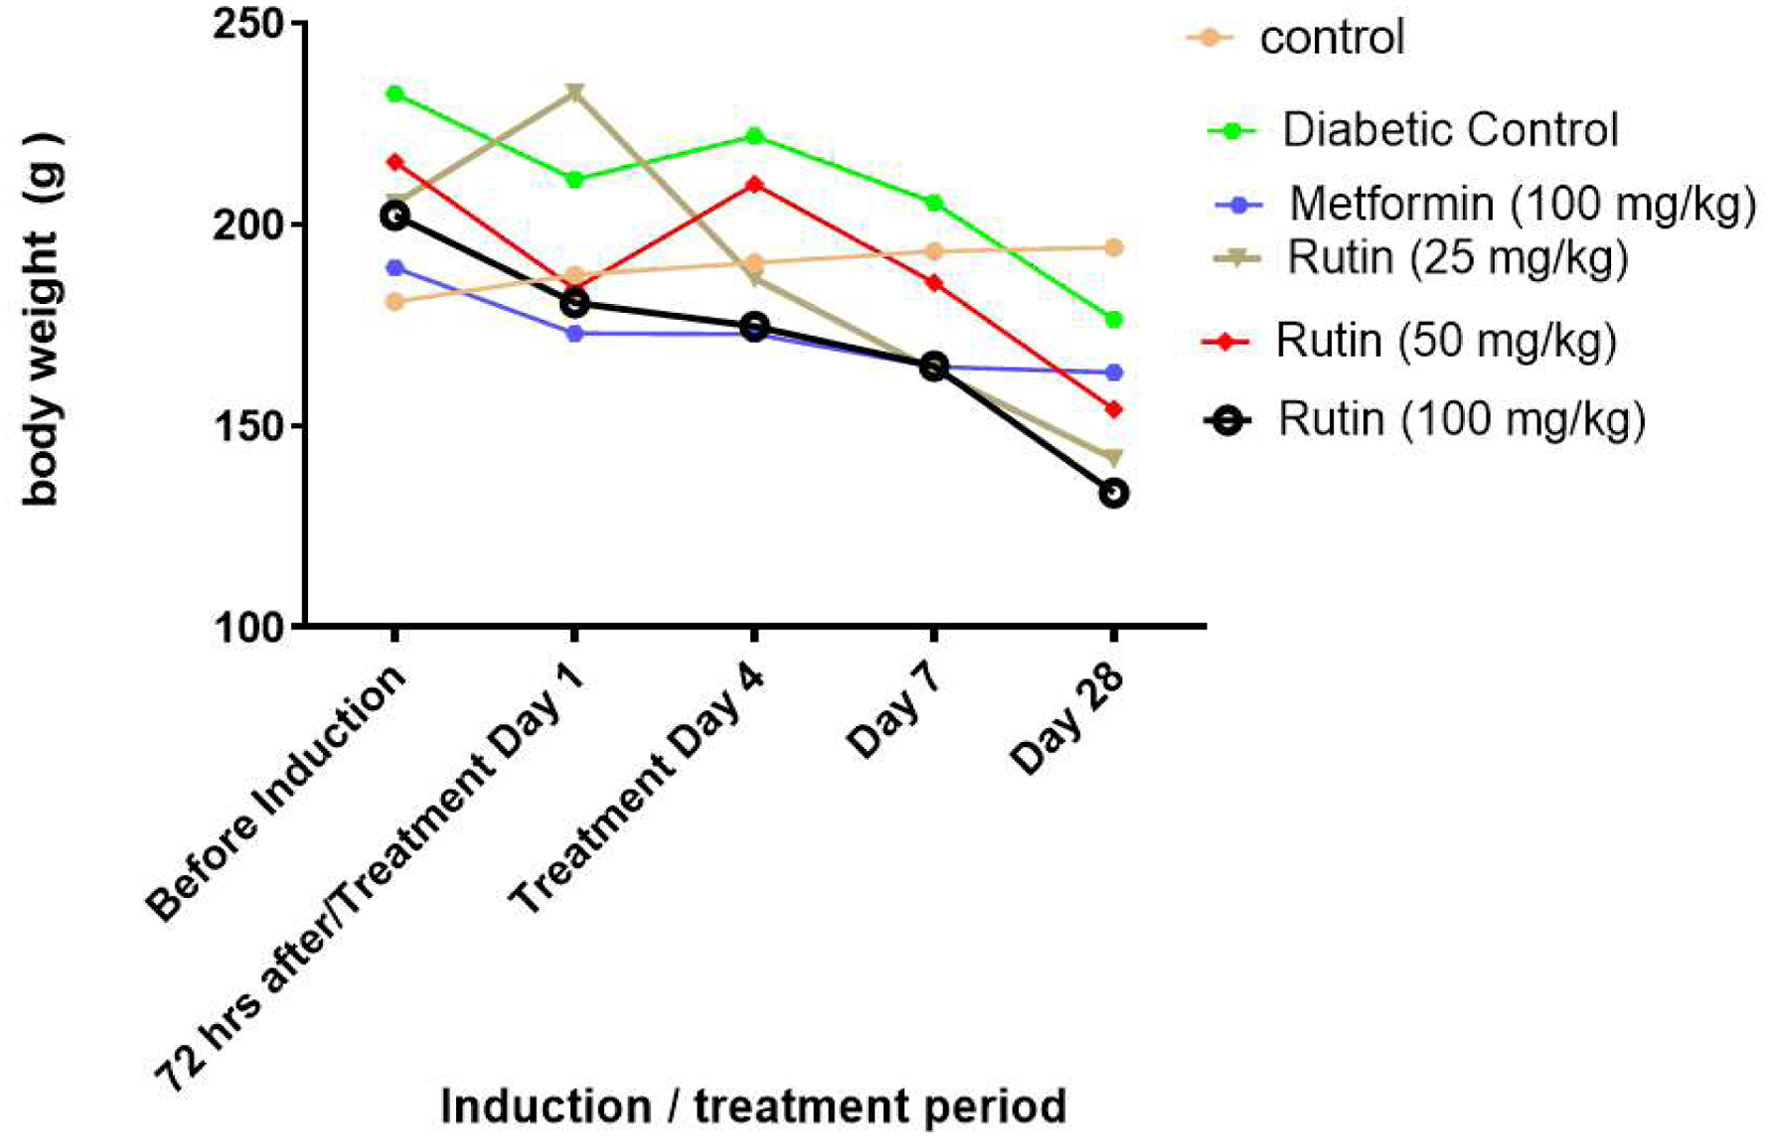
Figure 2. Line charts showing the effect of rutin on the weight of rats with streptozotocin-induced diabetes.
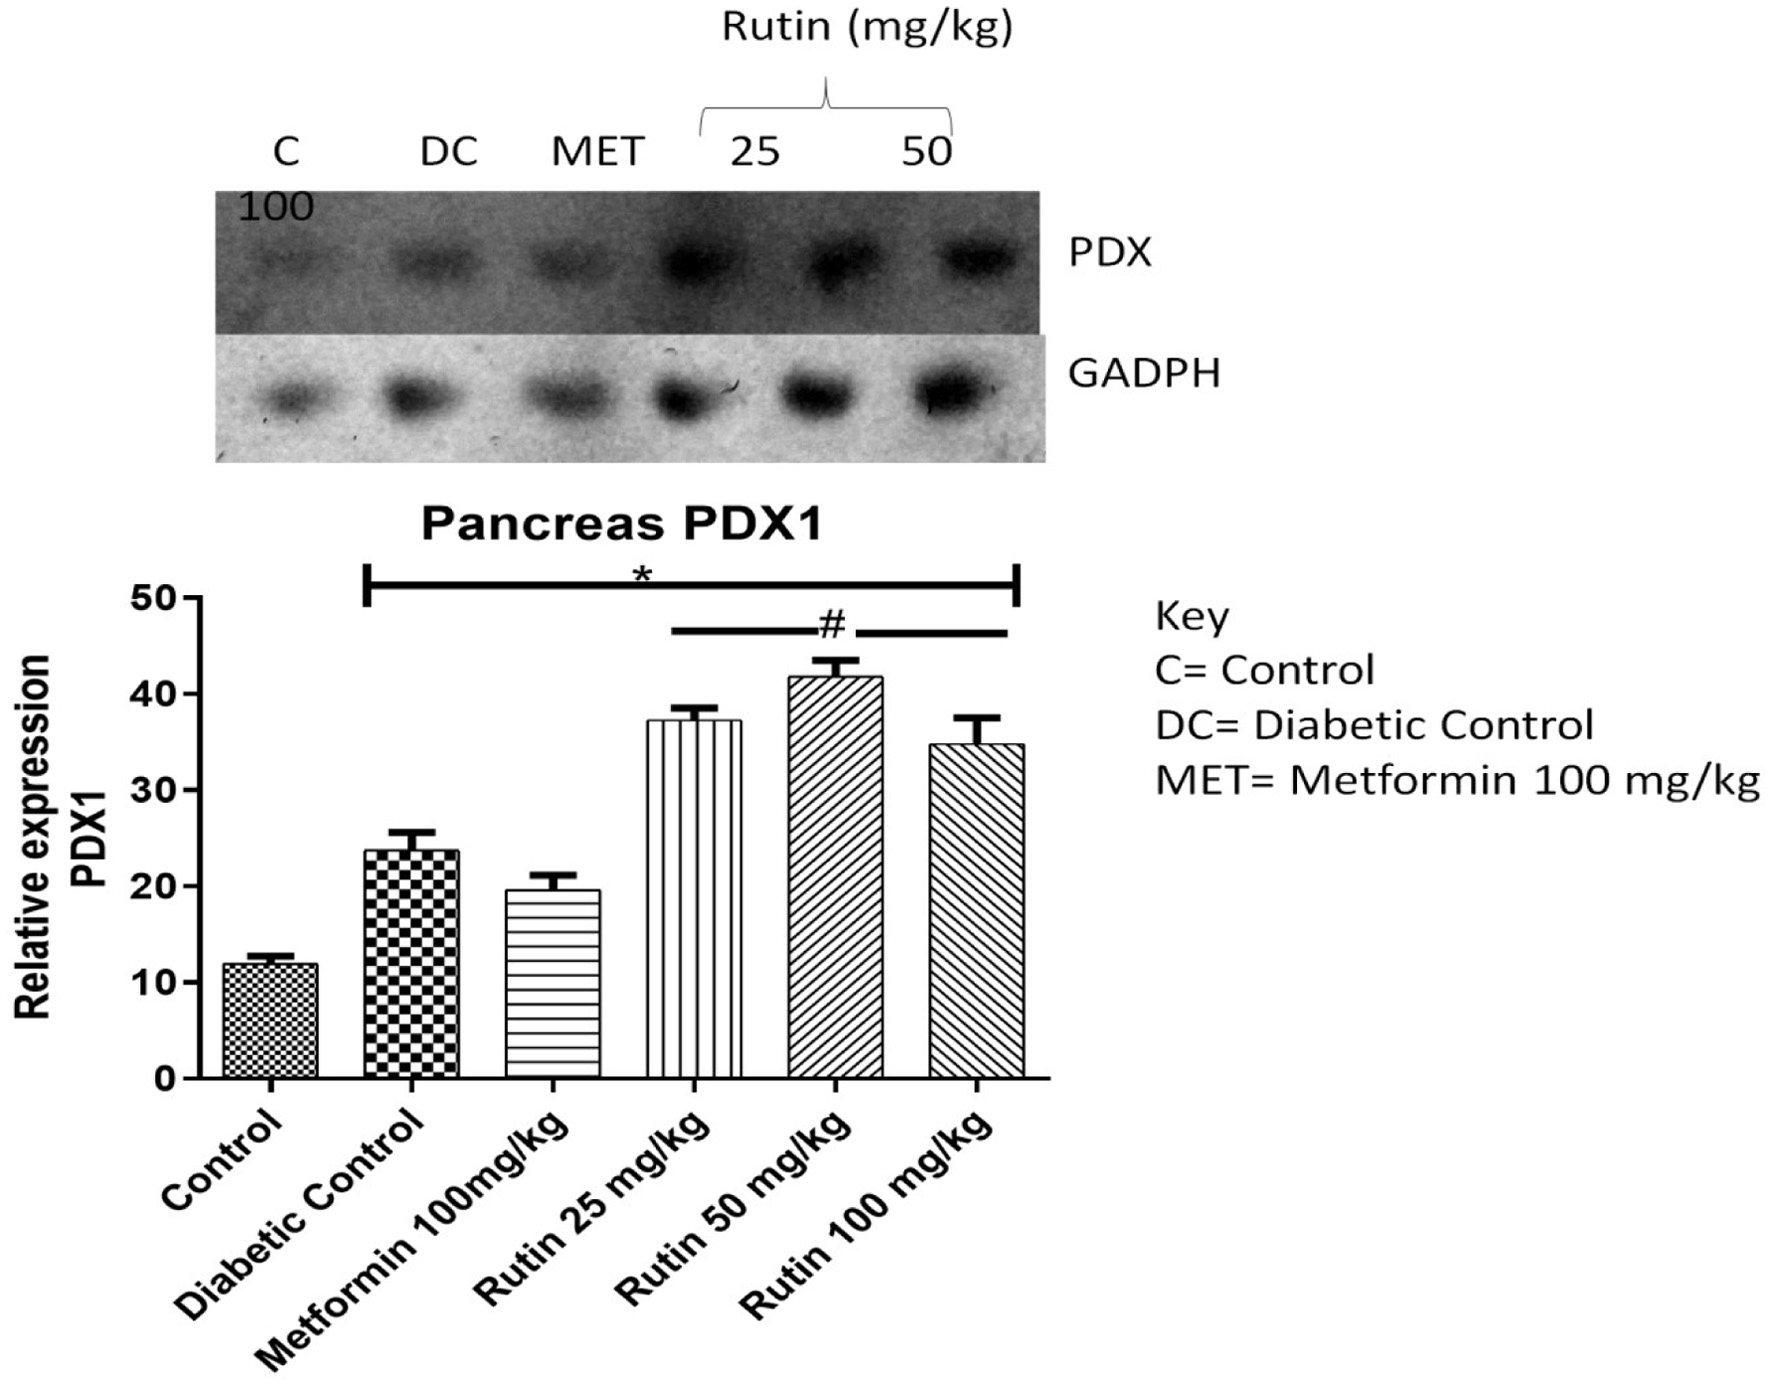
Figure 3. Pictorial view of RT-PCR agarose gel electrophoresis (AGE) for pancreatic and duodenal home box 1 (PDX-1) in rats with STZ-induced diabetes treated with rutin (n = 3) followed by densitometric analysis. * and # represent a significant variation between the control group and the diabetic control group respectively at p < 0.05.
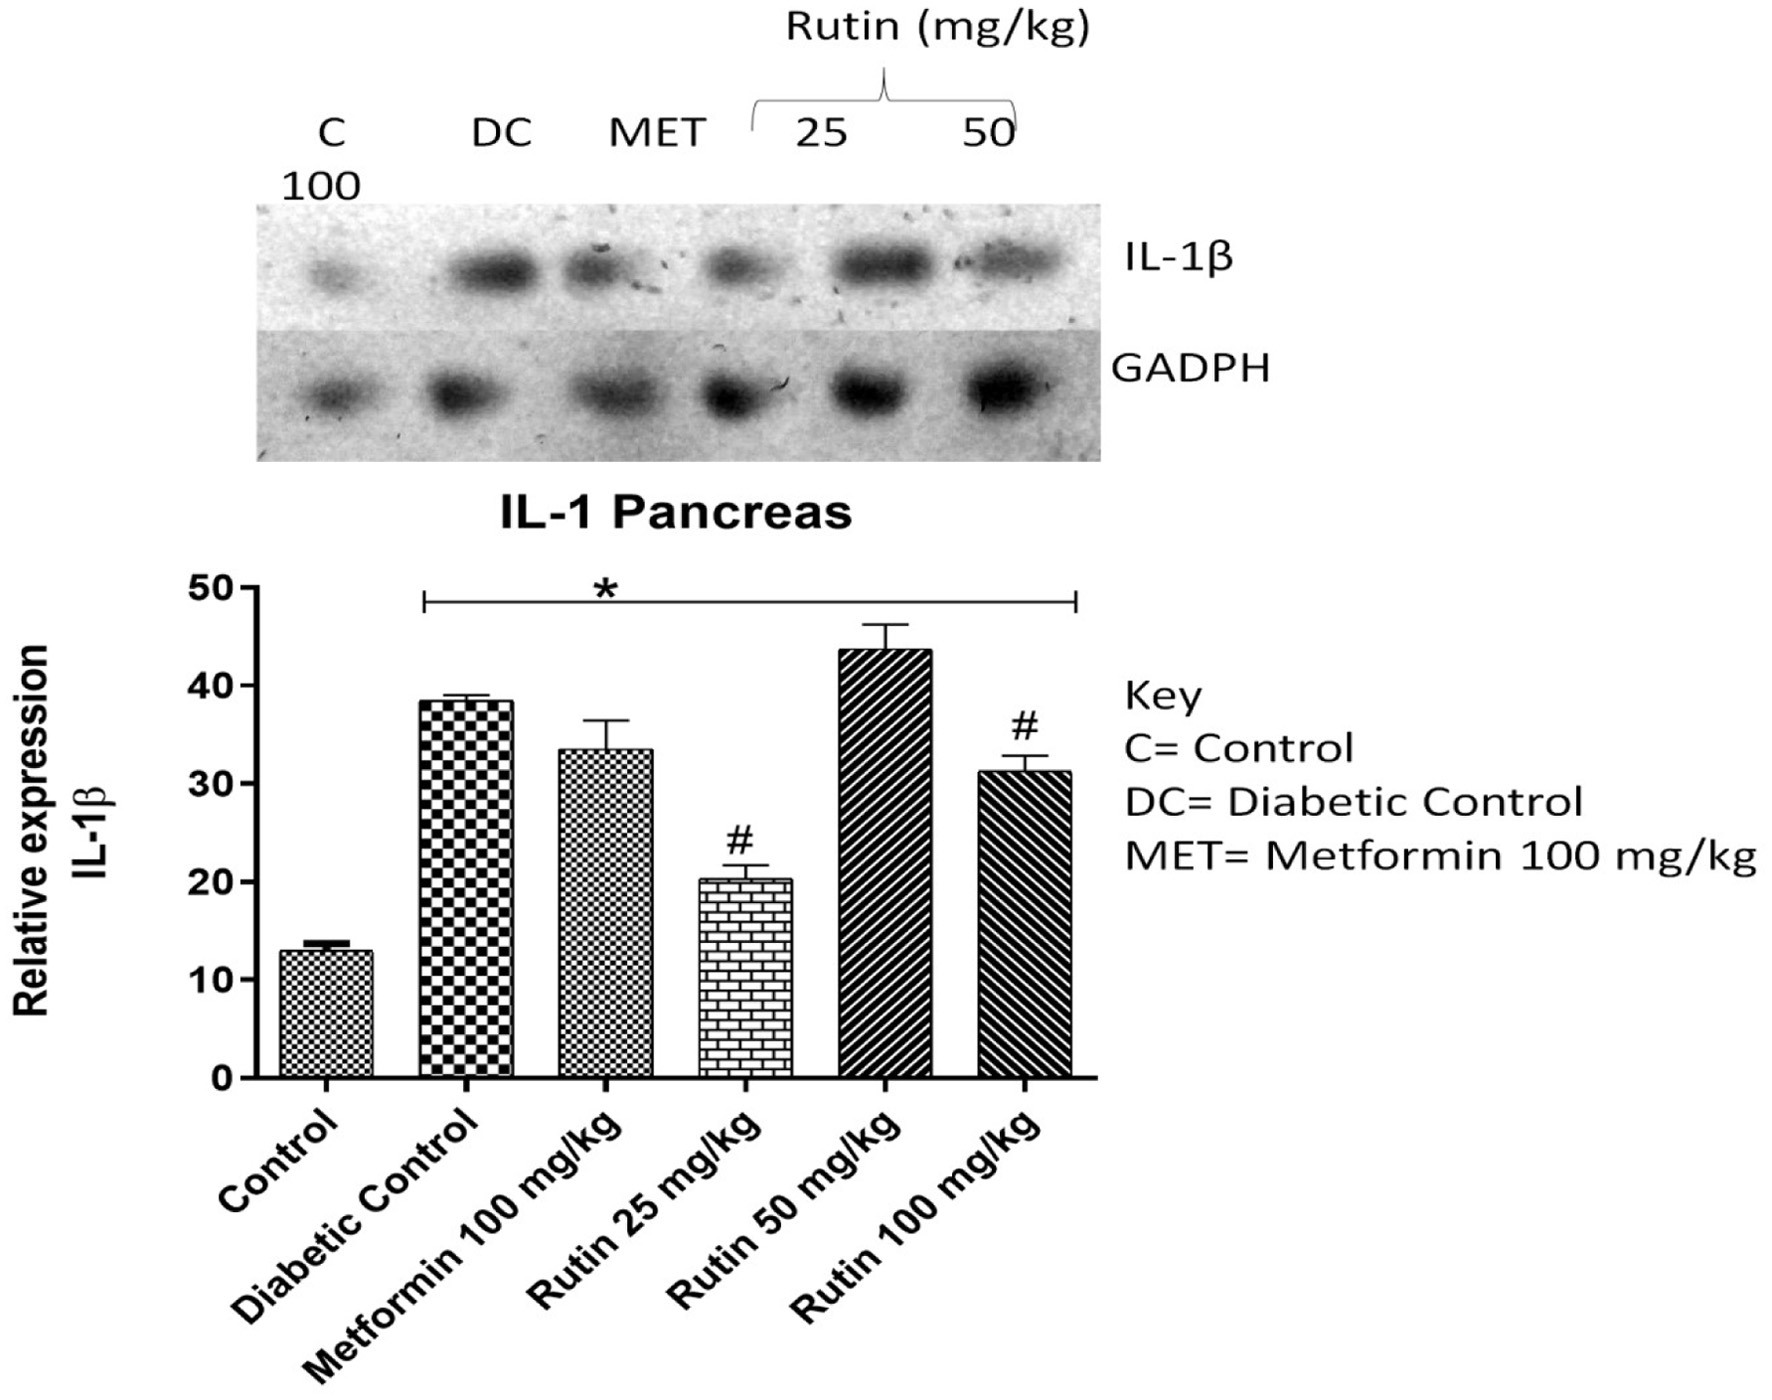
Figure 4. Pictorial view of RT-PCR AGE analysis of pancreatic interleukin-1 beta expression in rats with STZ-induced diabetes treated with rutin (n = 3) followed by densitometric analysis. * and # represent a significant variation between the control group and the diabetic control group respectively at p < 0.05.
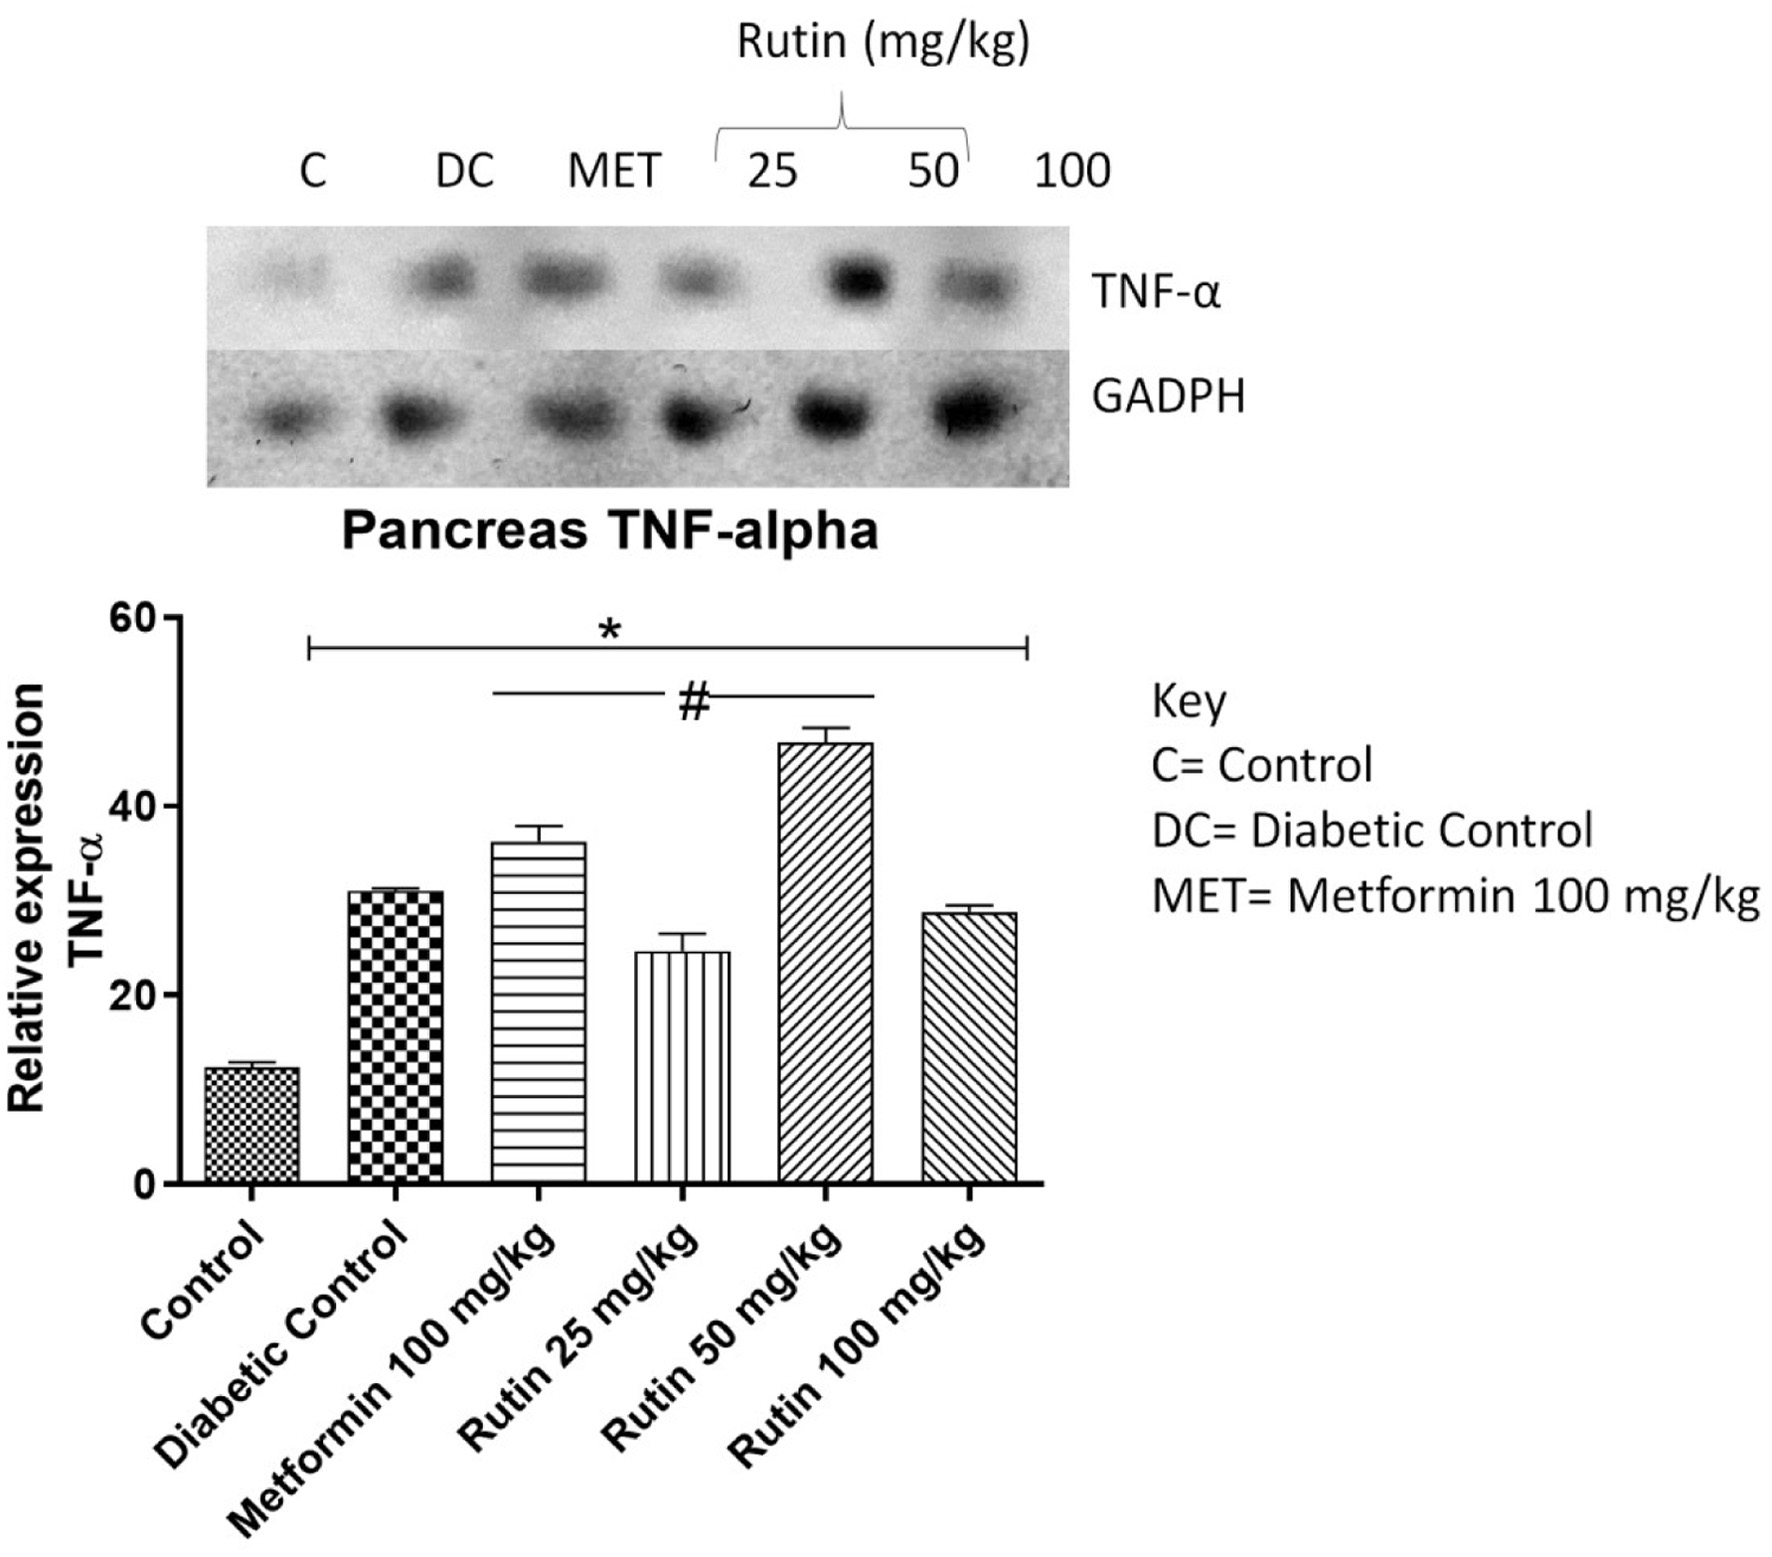
Figure 5. Pictorial view of RT-PCR AGE analysis of pancreatic TNF-α expression in STZ-induced diabetic rats orally administered rutin (n = 3) followed by densitometric analysis. * and # represent a significant variation between the control group and the diabetic control group respectively at p < 0.05.
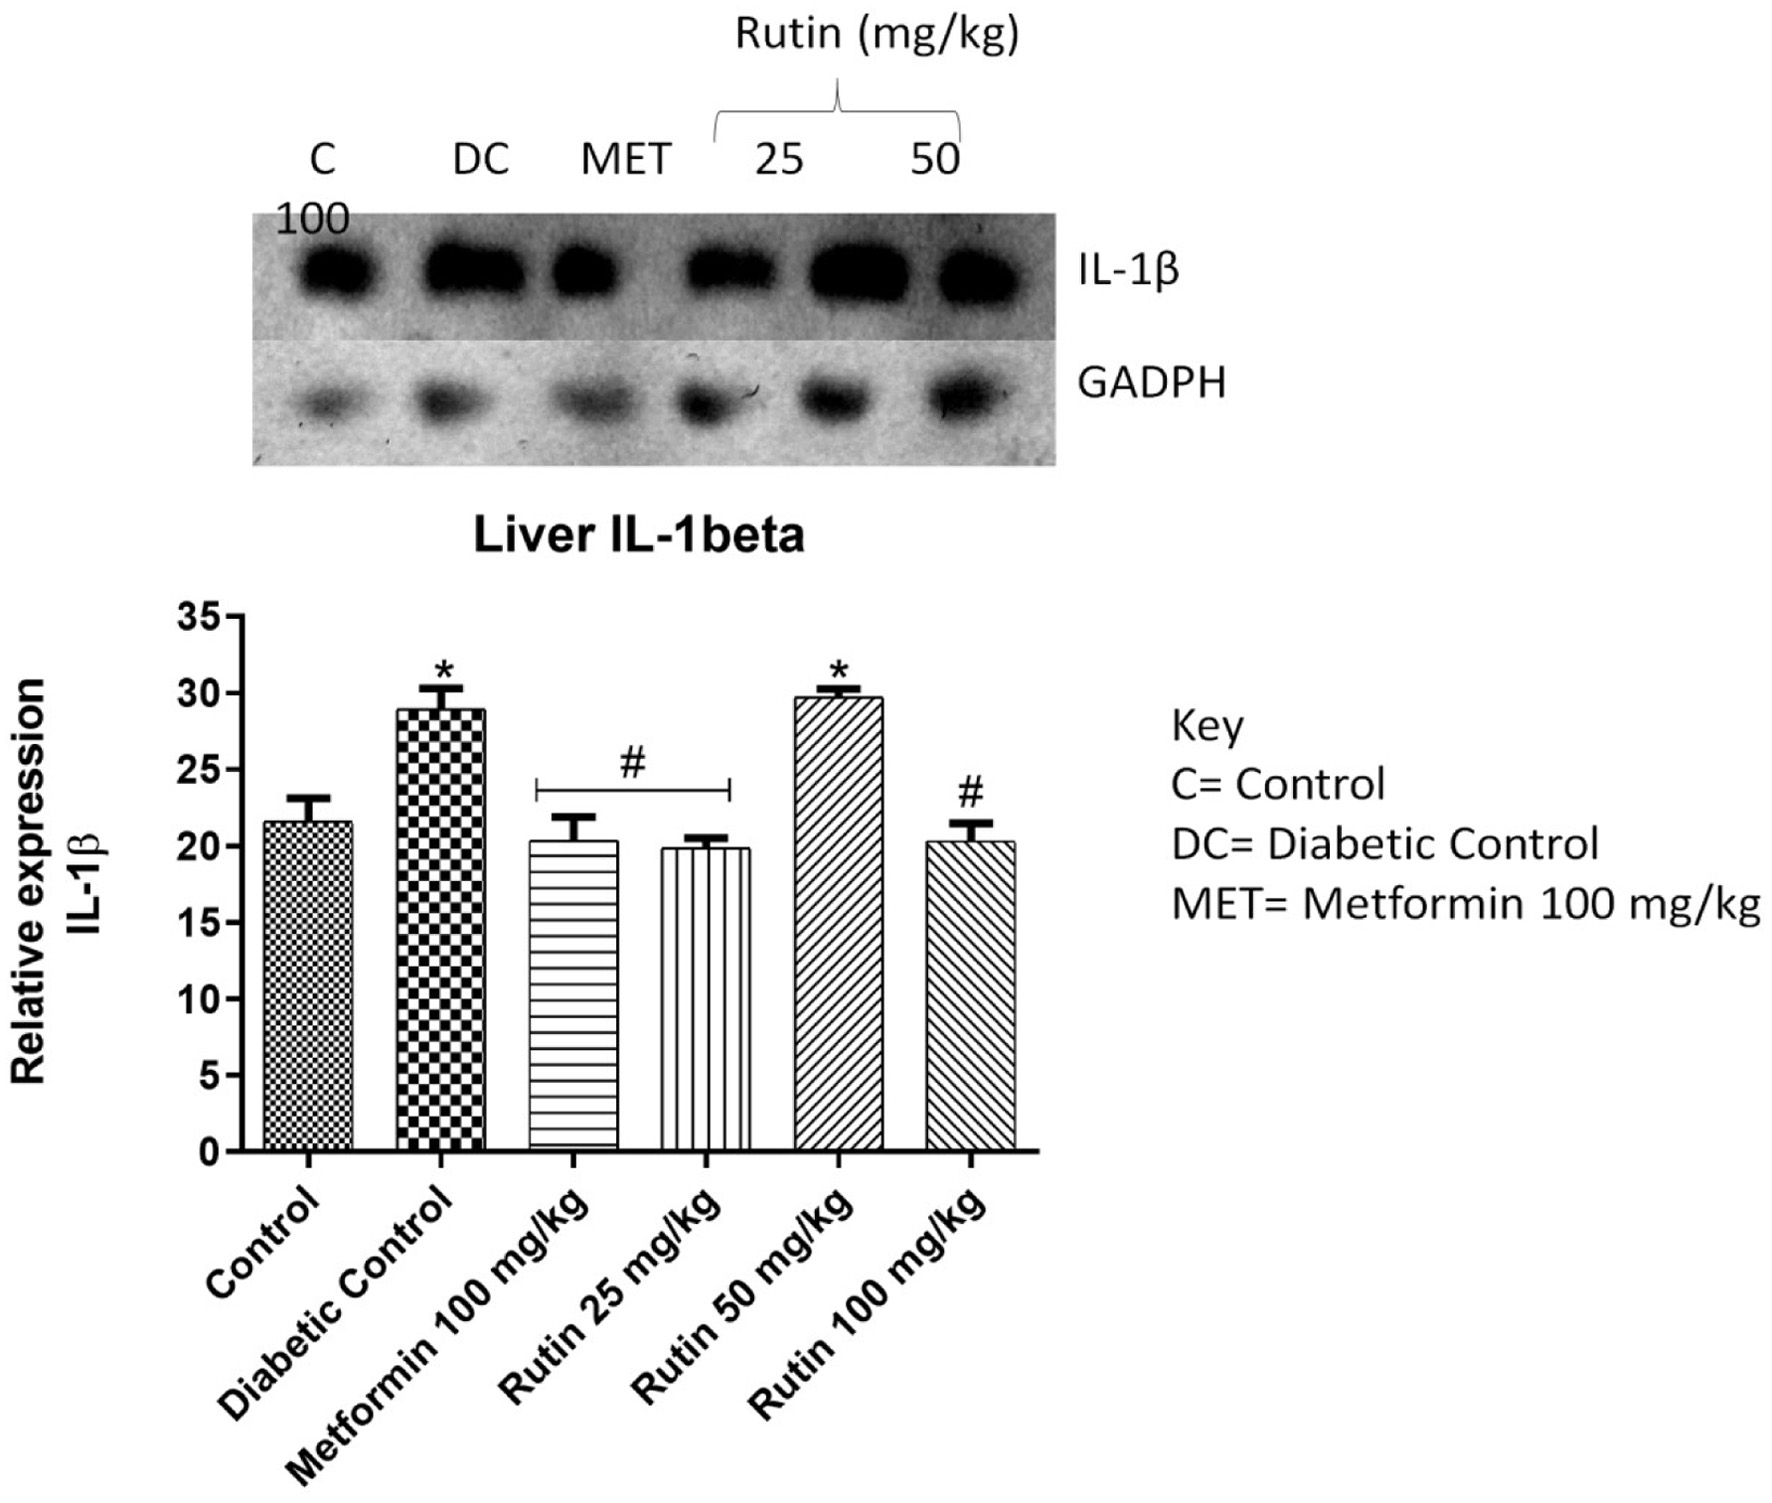
Figure 6. Pictorial view of RT-PCR AGE analysis of hepatic interleukin-1 beta expression in rats with STZ-induced diabetes treated with rutin (n = 3) followed by densitometric analysis. * and # represent a significant variation between the control group and the diabetic control group respectively at p < 0.05.
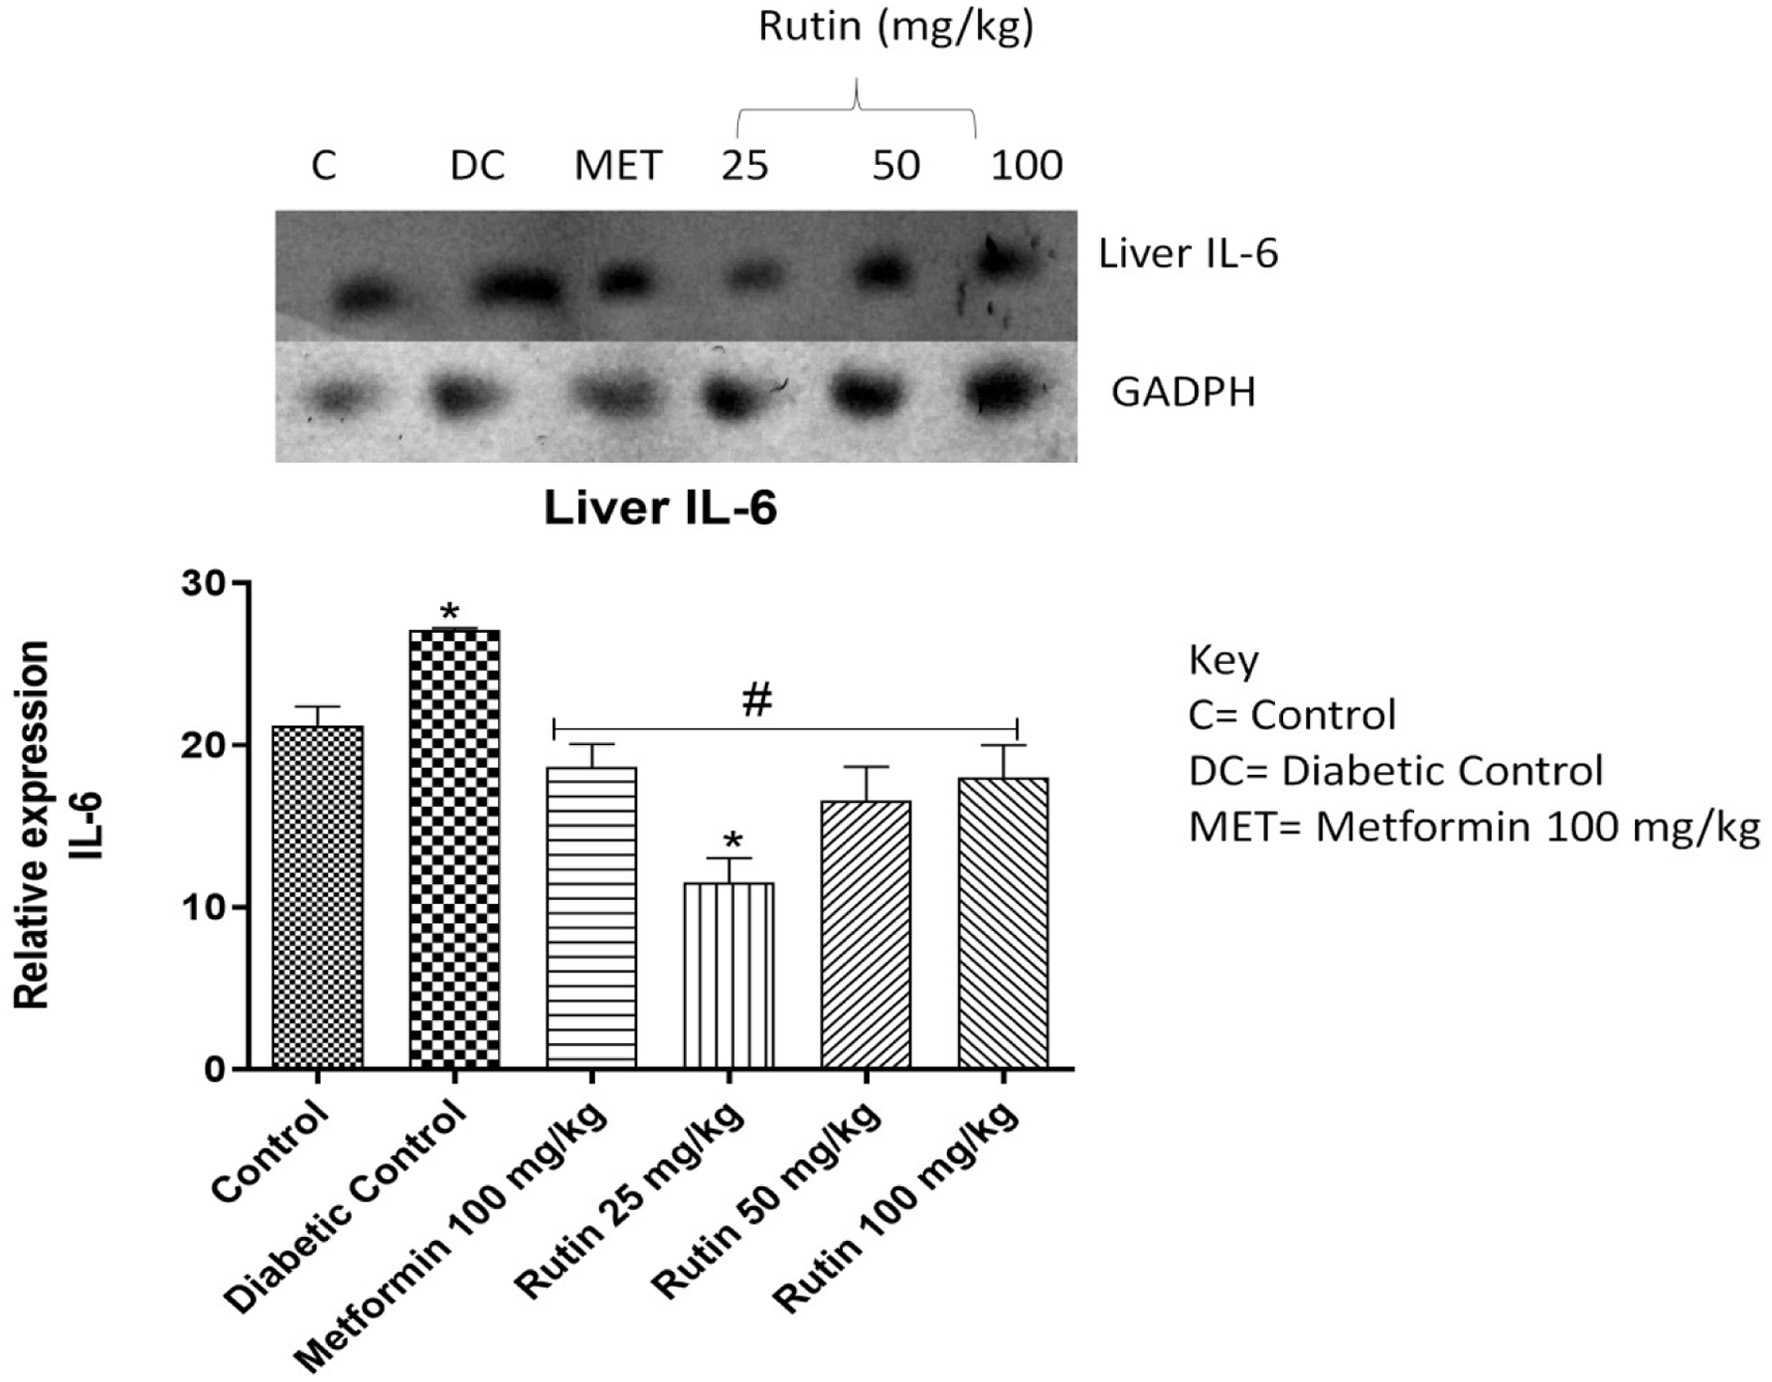
Figure 7. Pictorial view of RT-PCR AGE for interleukin-6 expression in rats with STZ-induced diabetes (n = 3) treated with rutin followed by densitometric analysis. * and # represent a significant variation between the control group and the diabetic control group respectively at p < 0.05.
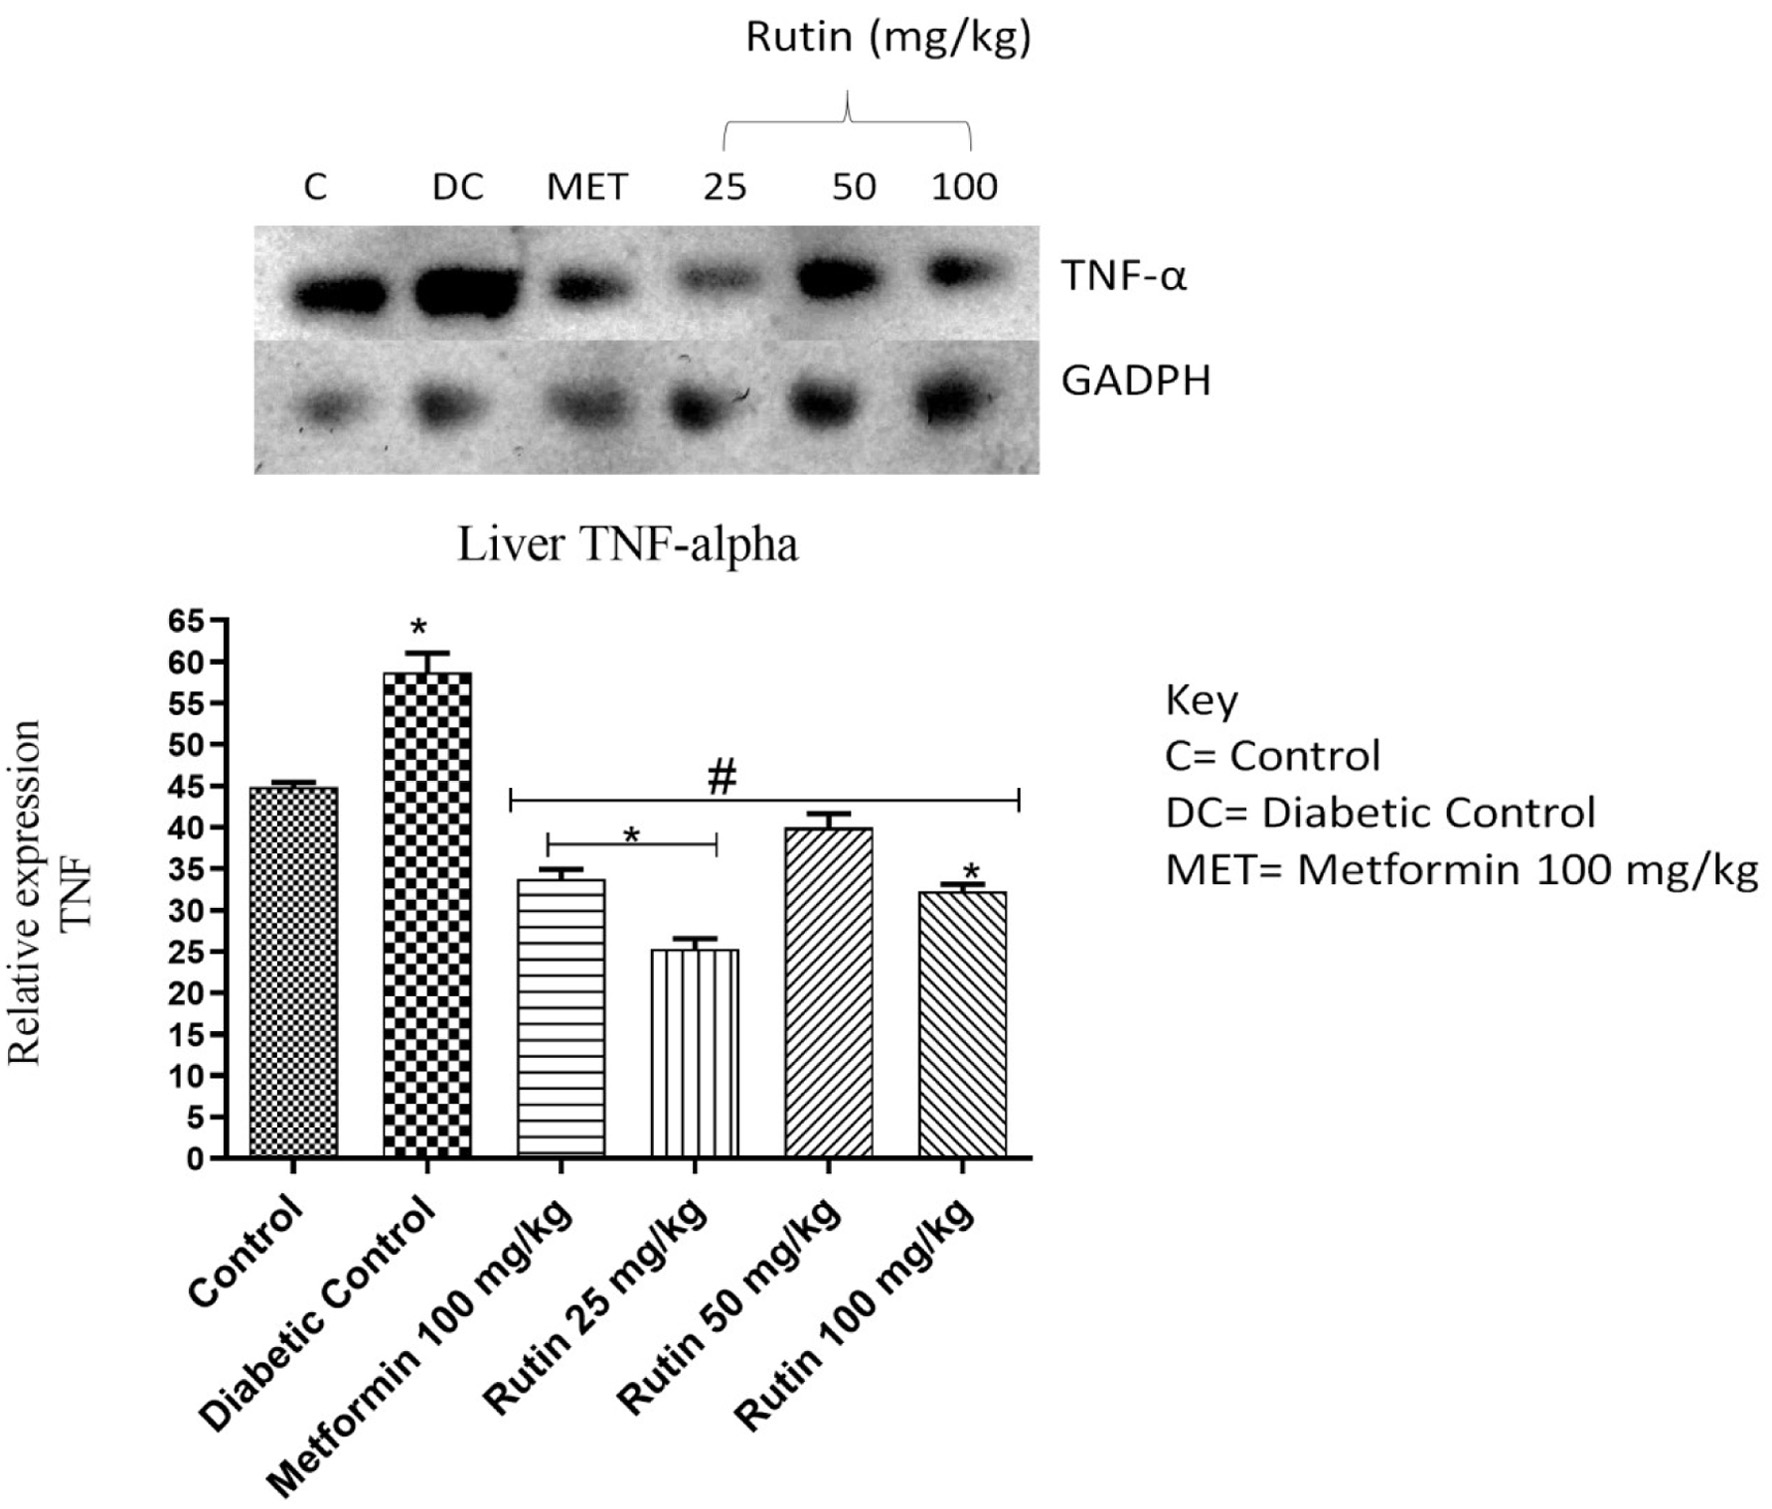
Figure 8. Pictorial view of RT-PCR AGE for hepatic tumour necrosis factor (TNF-α) in rats with STZ-induced diabetes treated with rutin (n = 3) followed by densitometric analysis. * and # represent a significant variation between the control group and the diabetic control group respectively at p < 0.05.
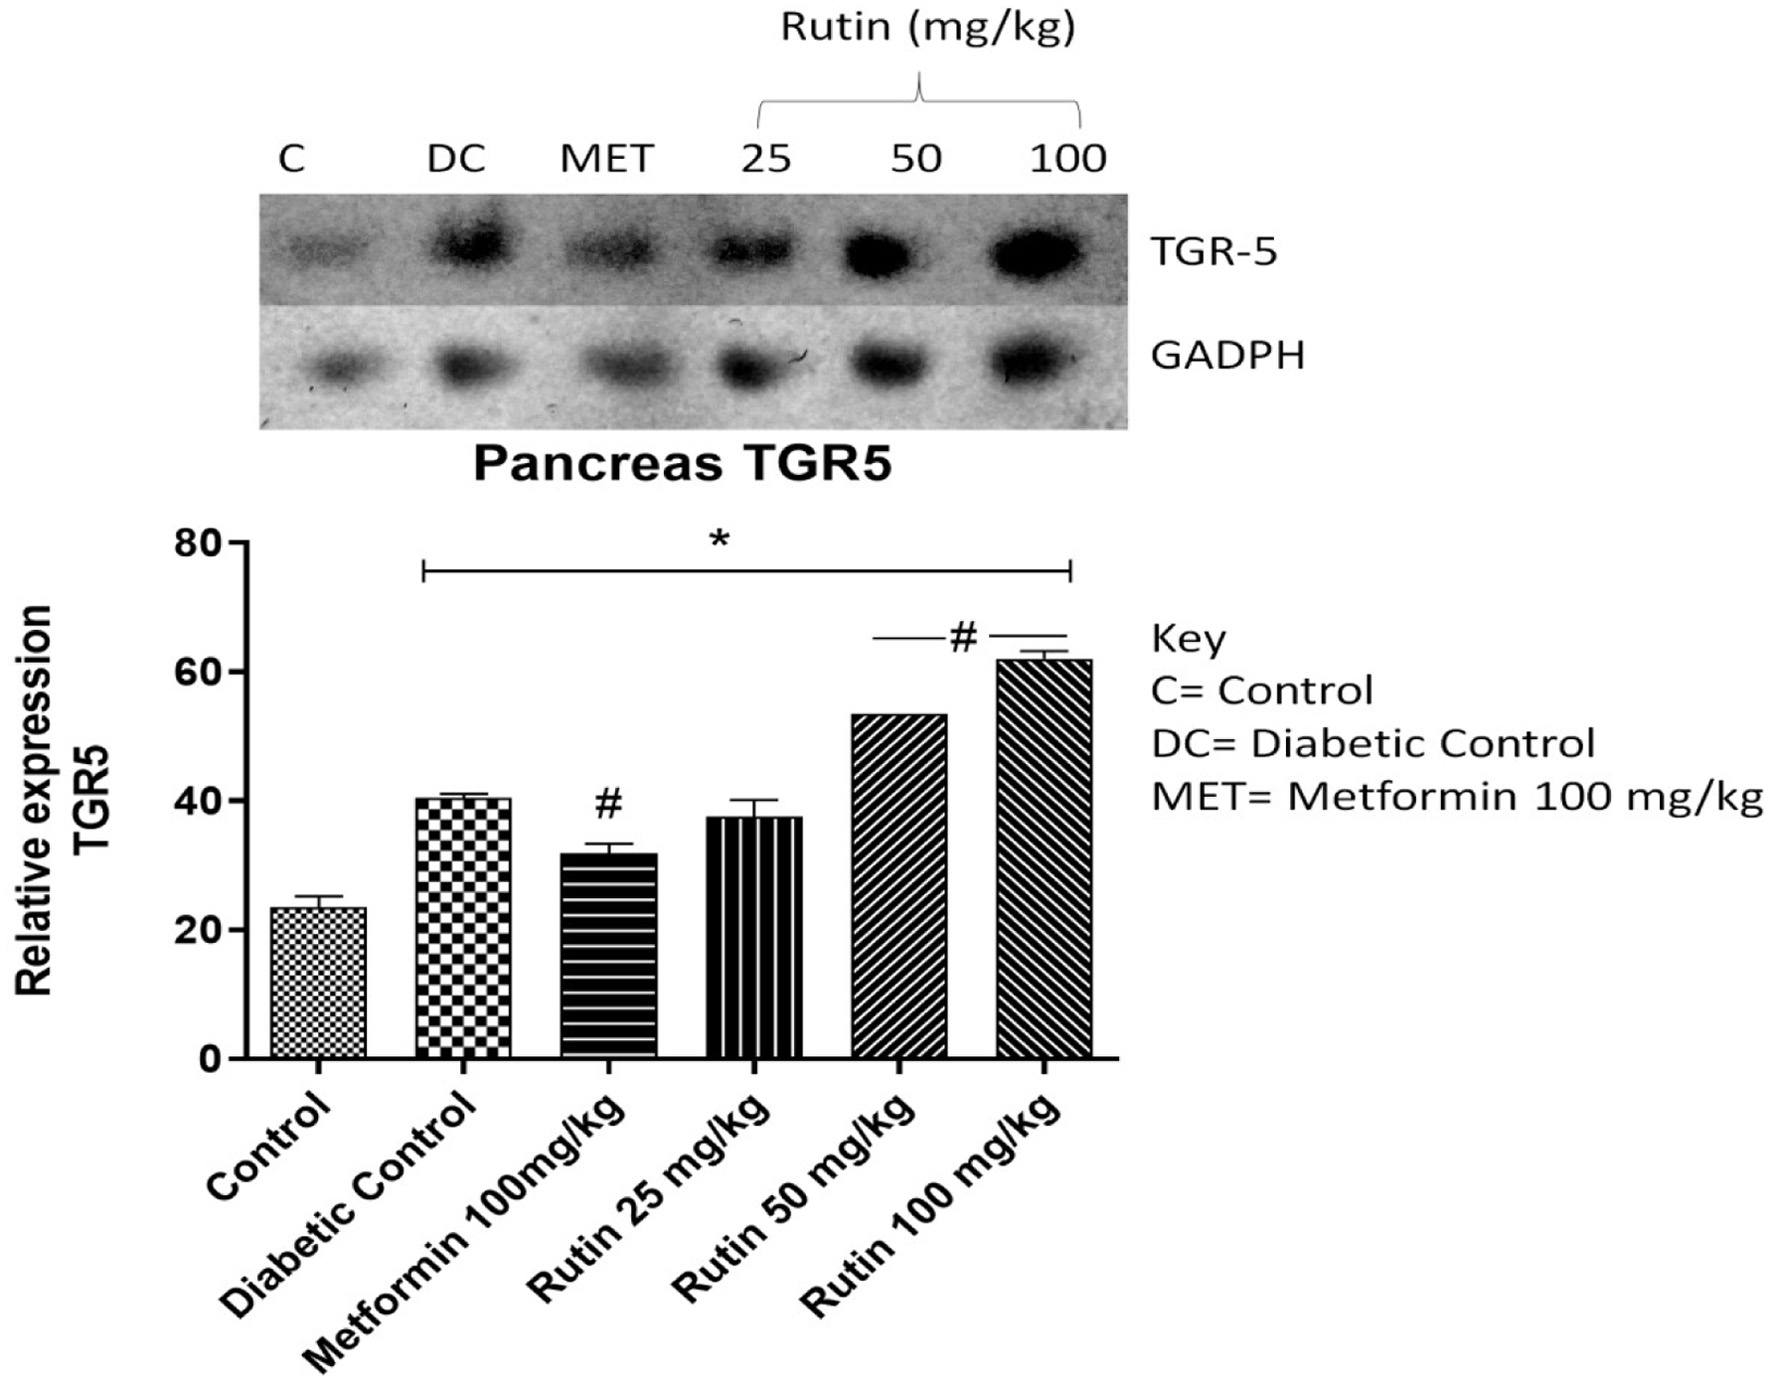
Figure 9. Pictorial view of RT-PCR AGE for pancreatic Takeda G-protein-coupled receptor 5 (TGR5) in rats with STZ-induced diabetes treated with rutin (n = 3) followed by densitometric analysis. * and # represent a significant variation between the control group and the diabetic control group respectively at p < 0.05.
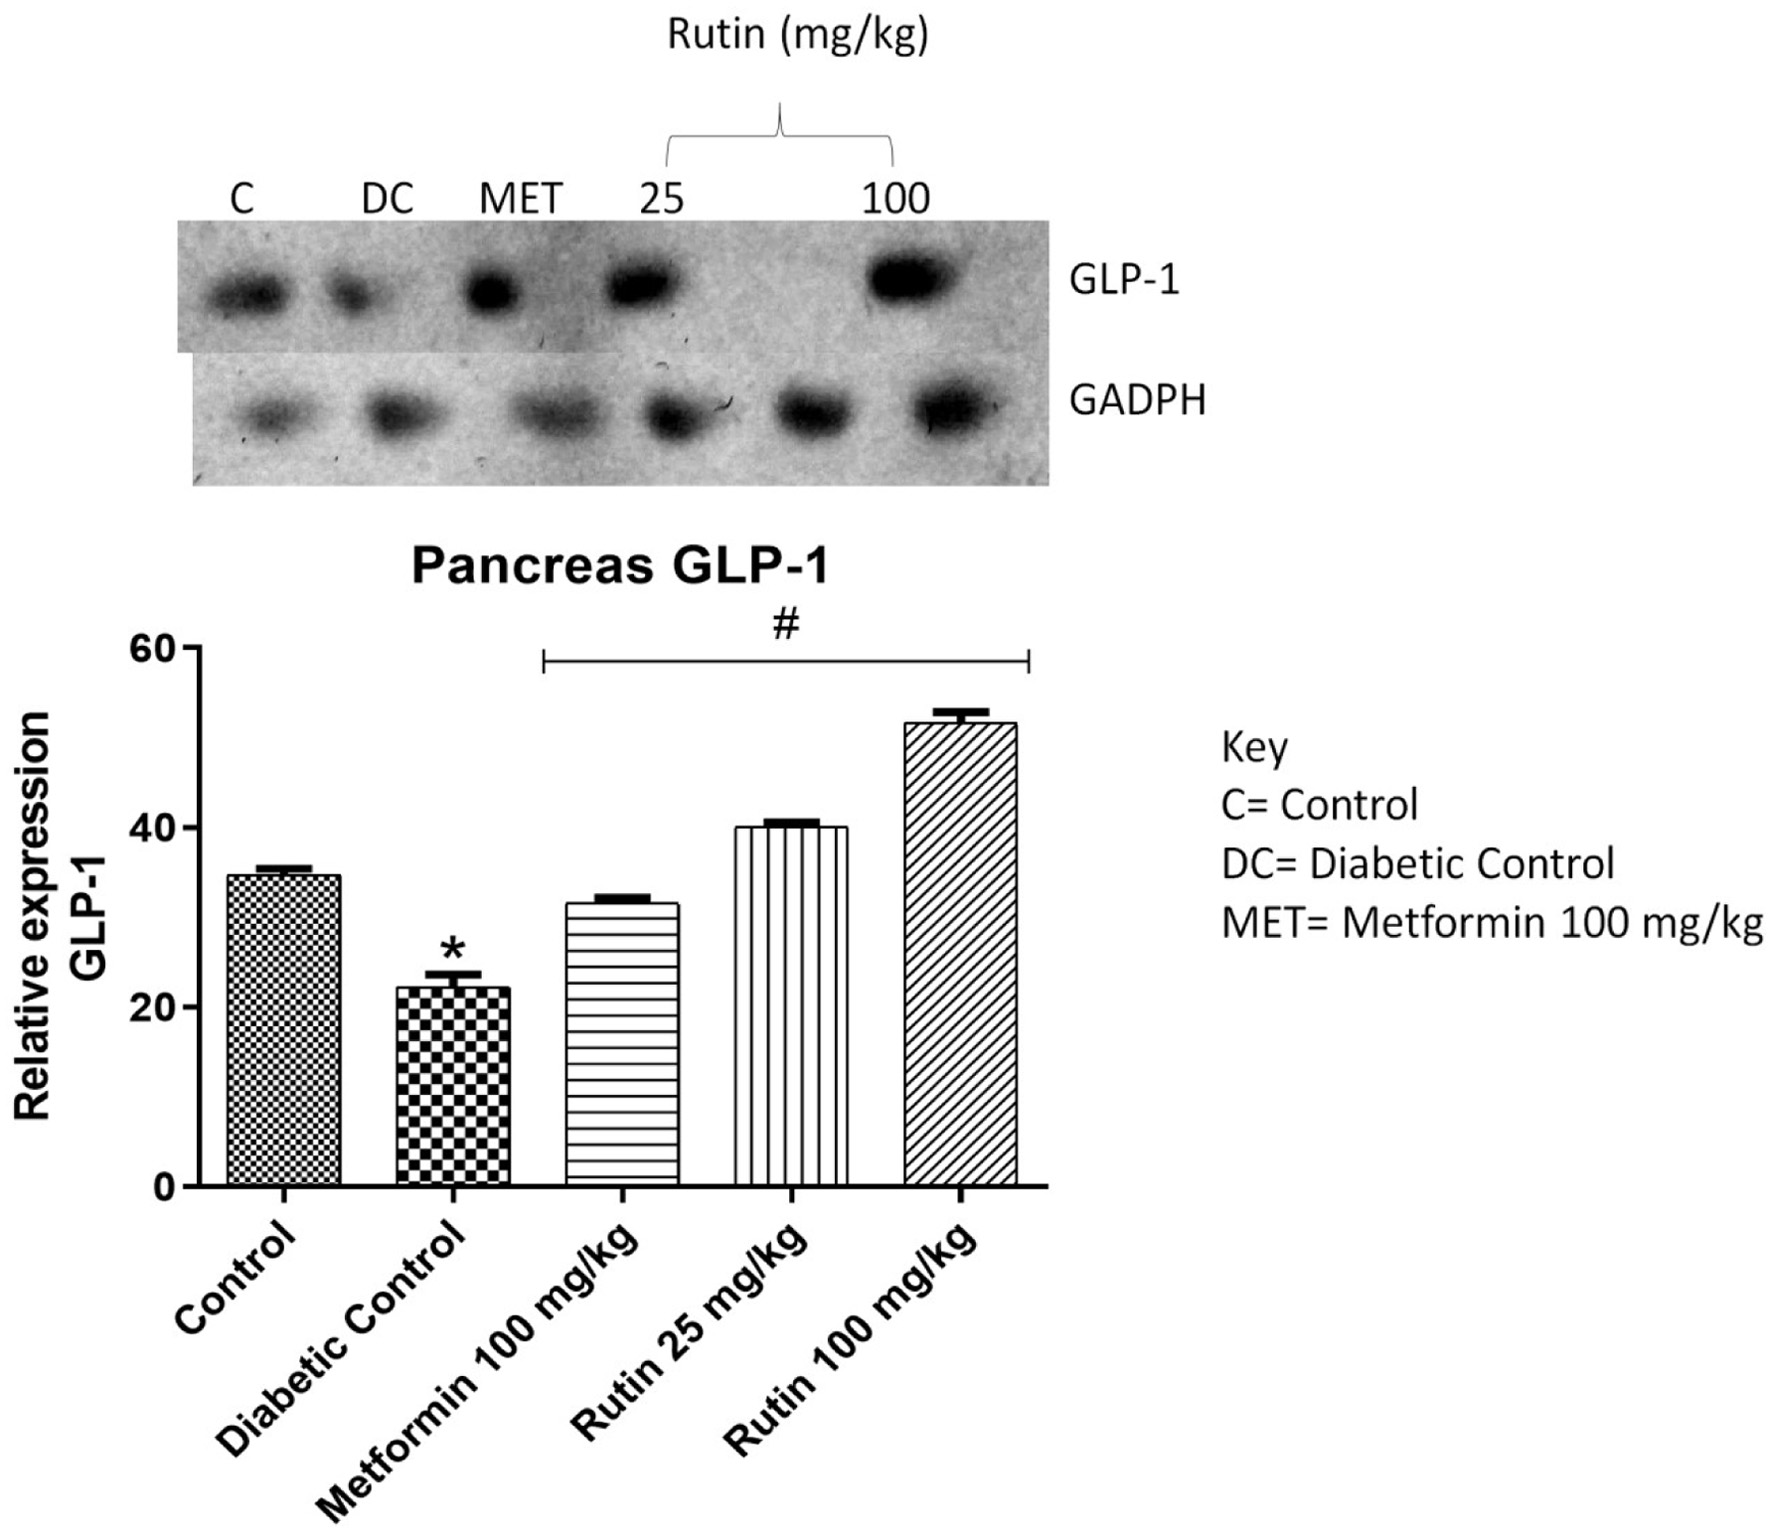
Figure 10. Pictorial view of RT-PCR AGE for pancreatic glucagon-like peptide-1 (GLP-1) in rats with STZ-induced diabetes treated with rutin (n = 3) followed by densitometric analysis. * and # represent a significant variation between the control group and the diabetic control group respectively at p < 0.05.
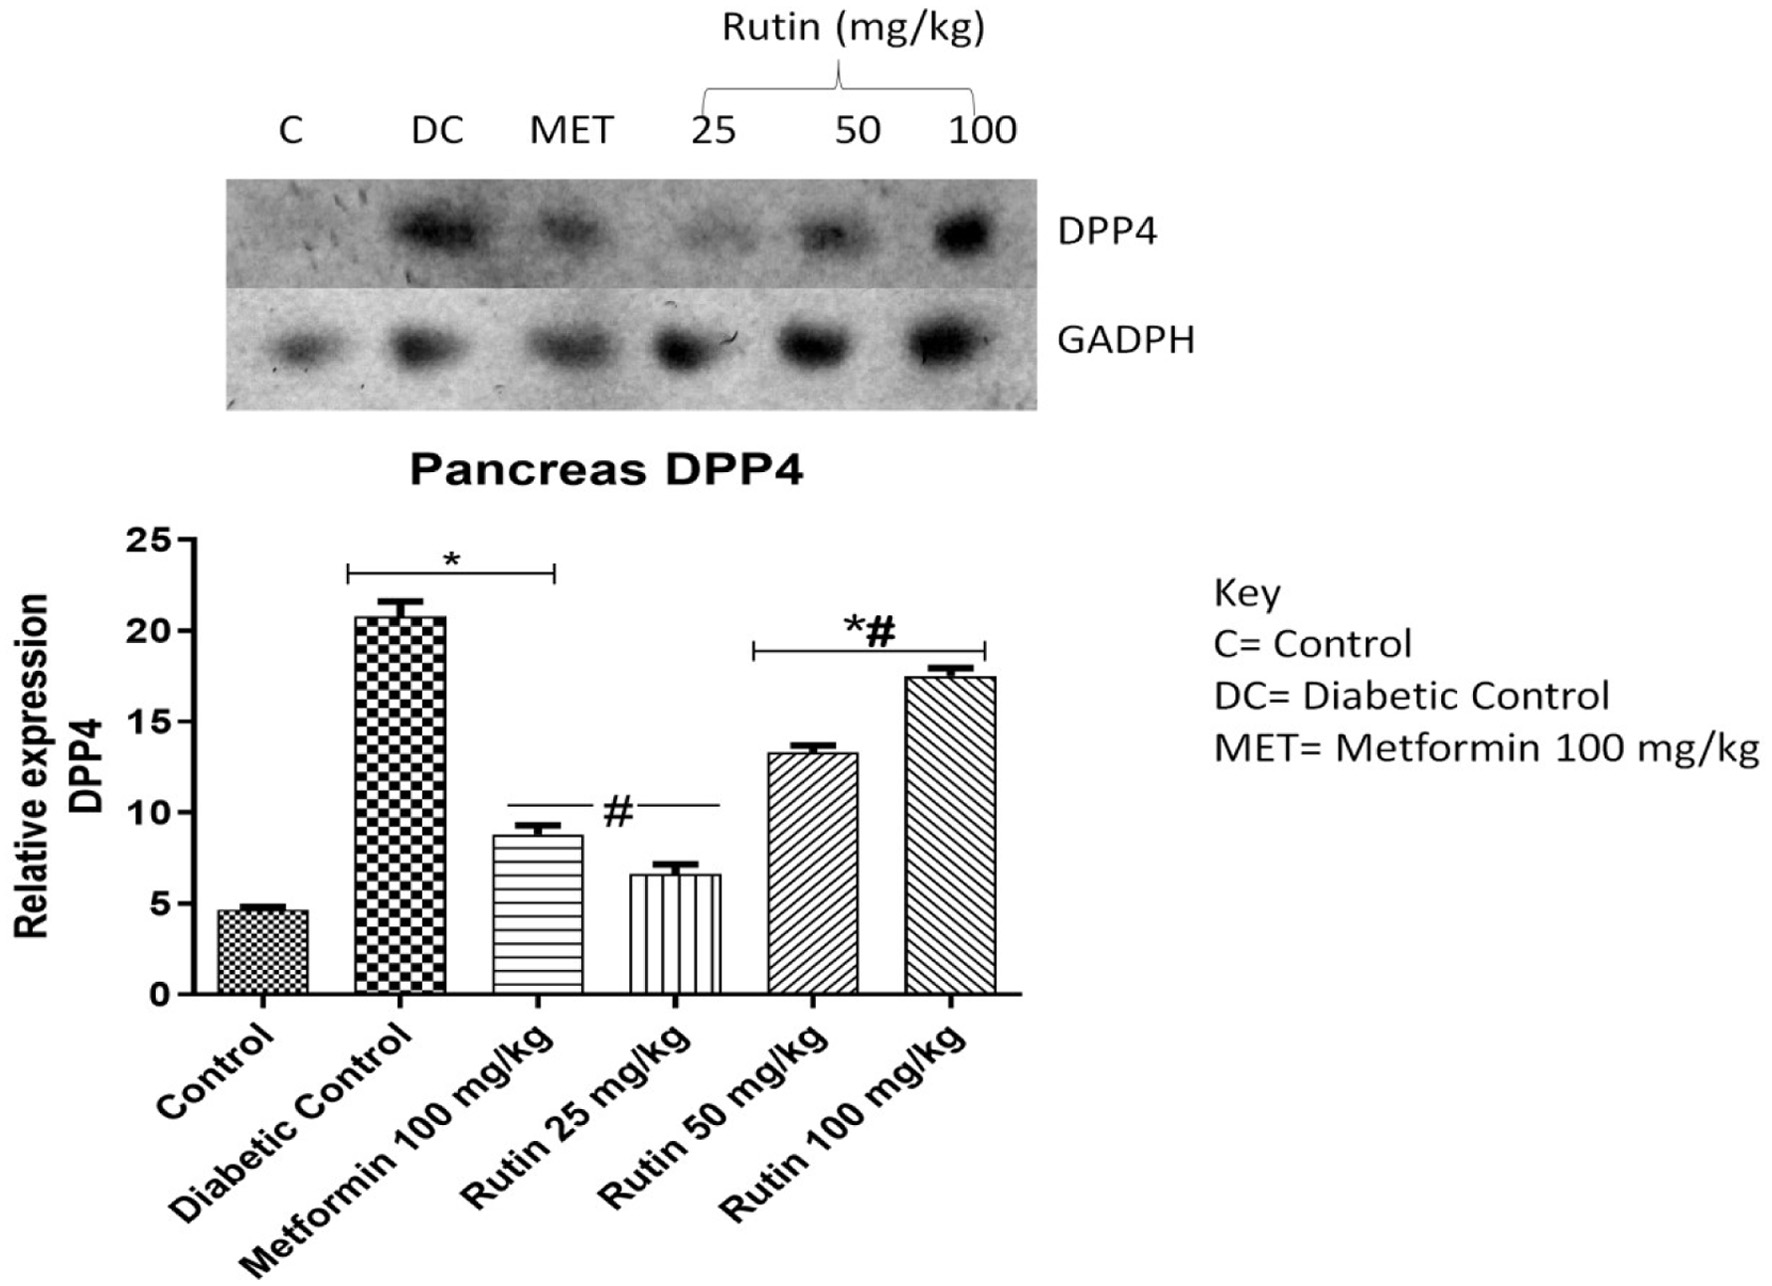
Figure 11. Pictorial view of RT-PCR AGE for pancreatic dipeptidyl peptidase-4 (DPP4) in rats with STZ-induced diabetes treated with rutin (n = 3) followed by densitometric analysis. * and # represent a significant variation between the control group and the diabetic control group respectively at p < 0.05.
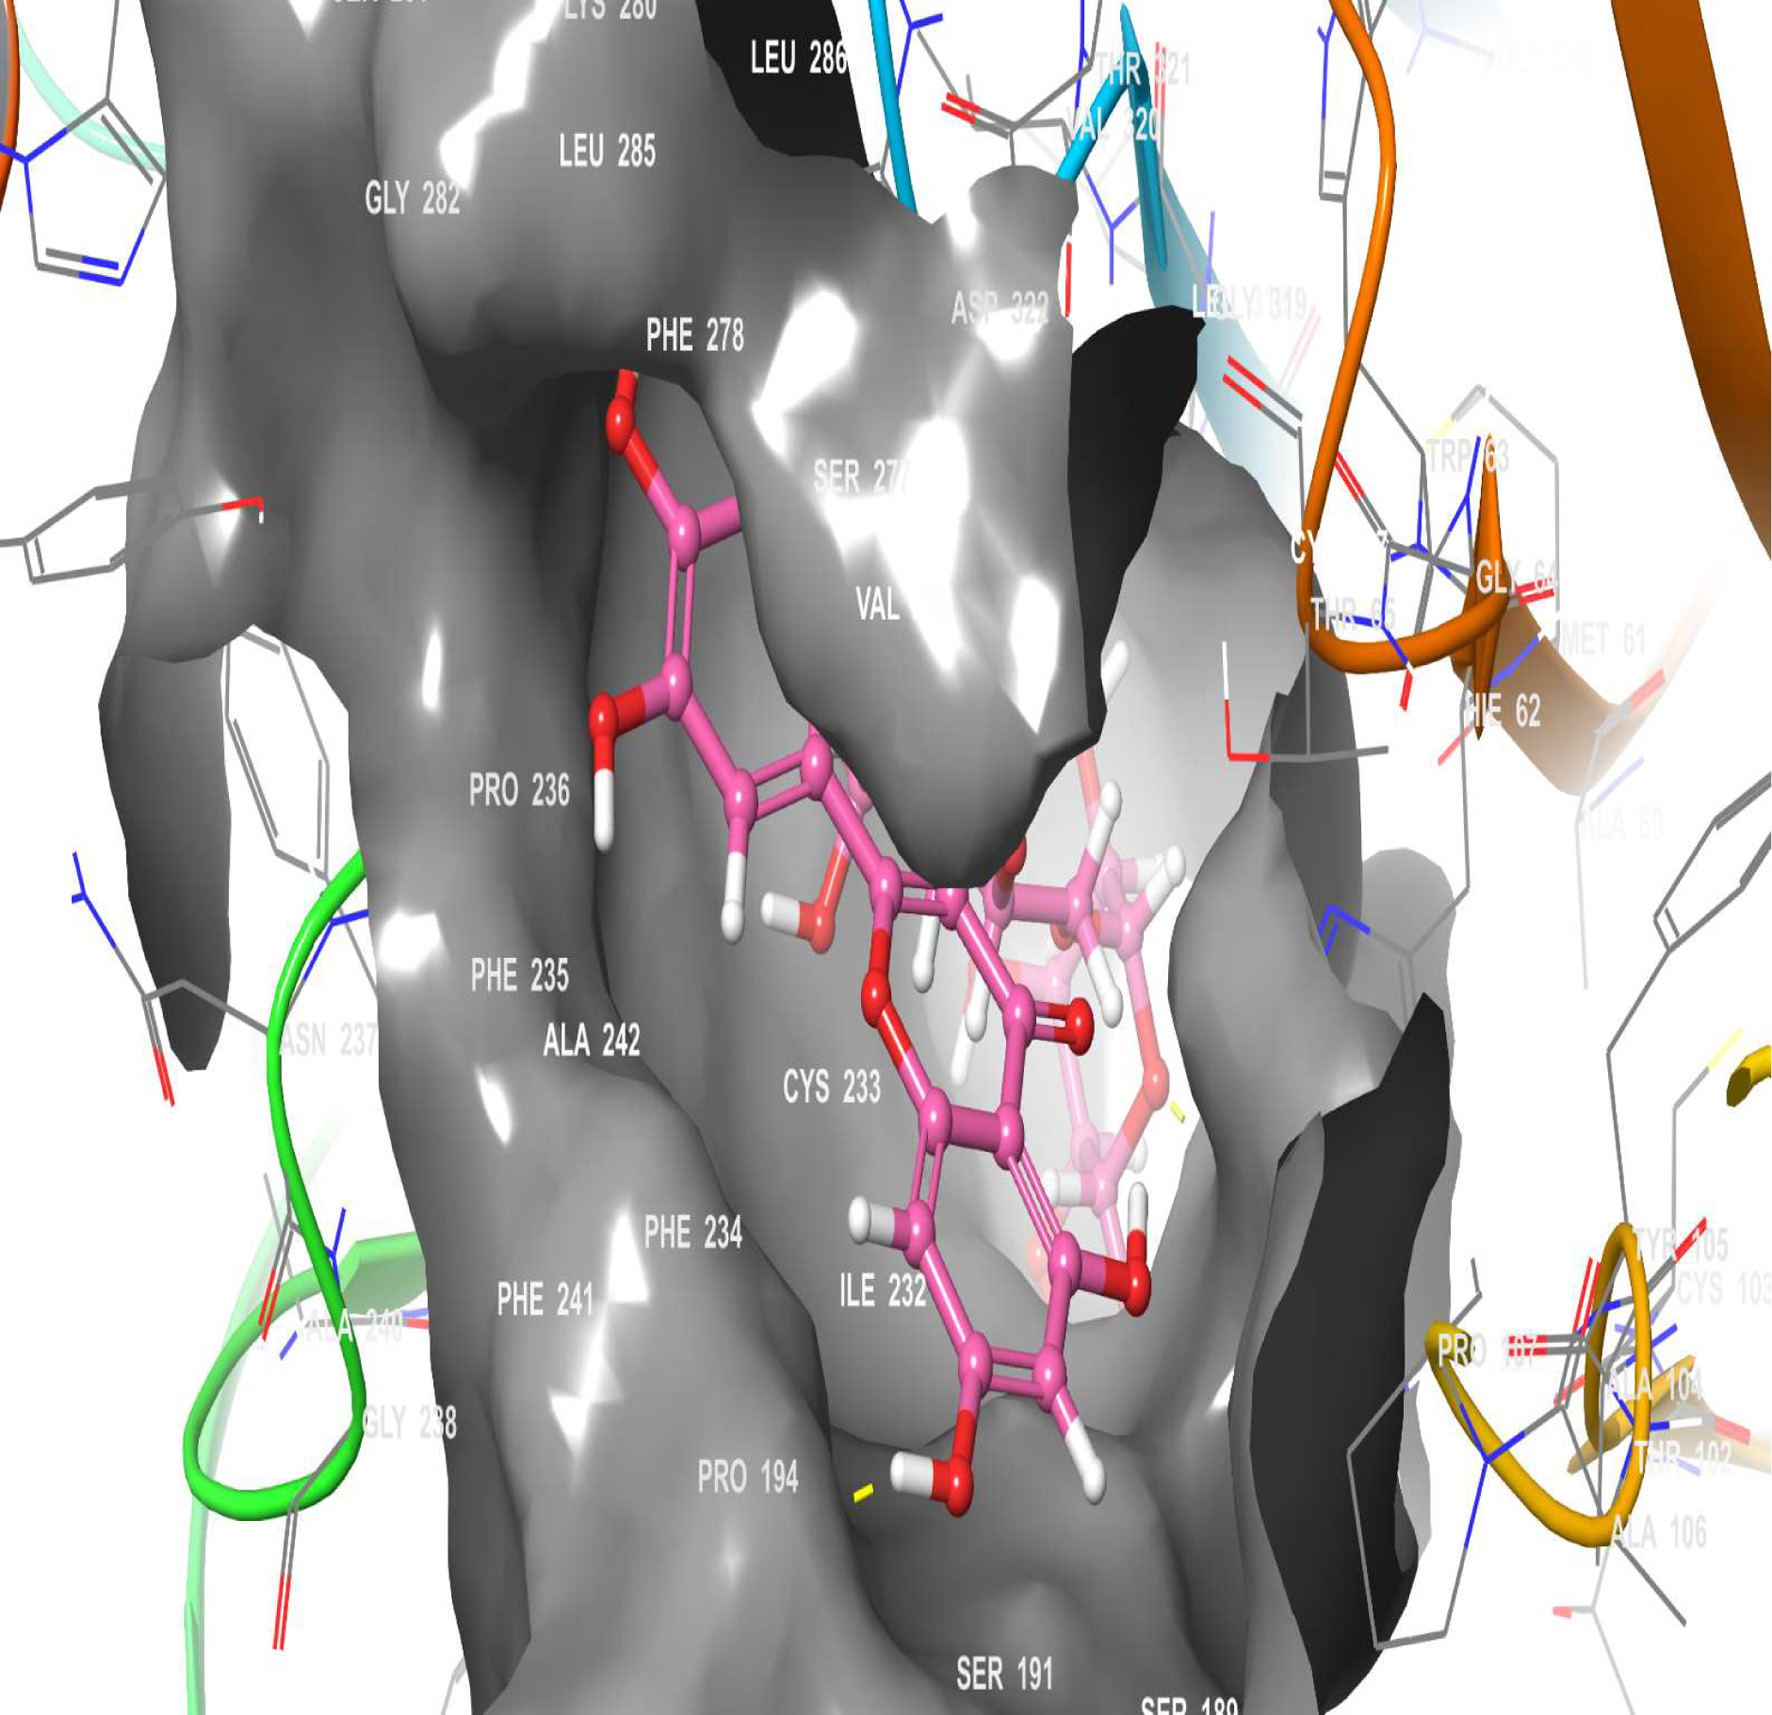
Figure 12. The 3D chemical relationship of Rutin with TGR5 with amino acid residues.
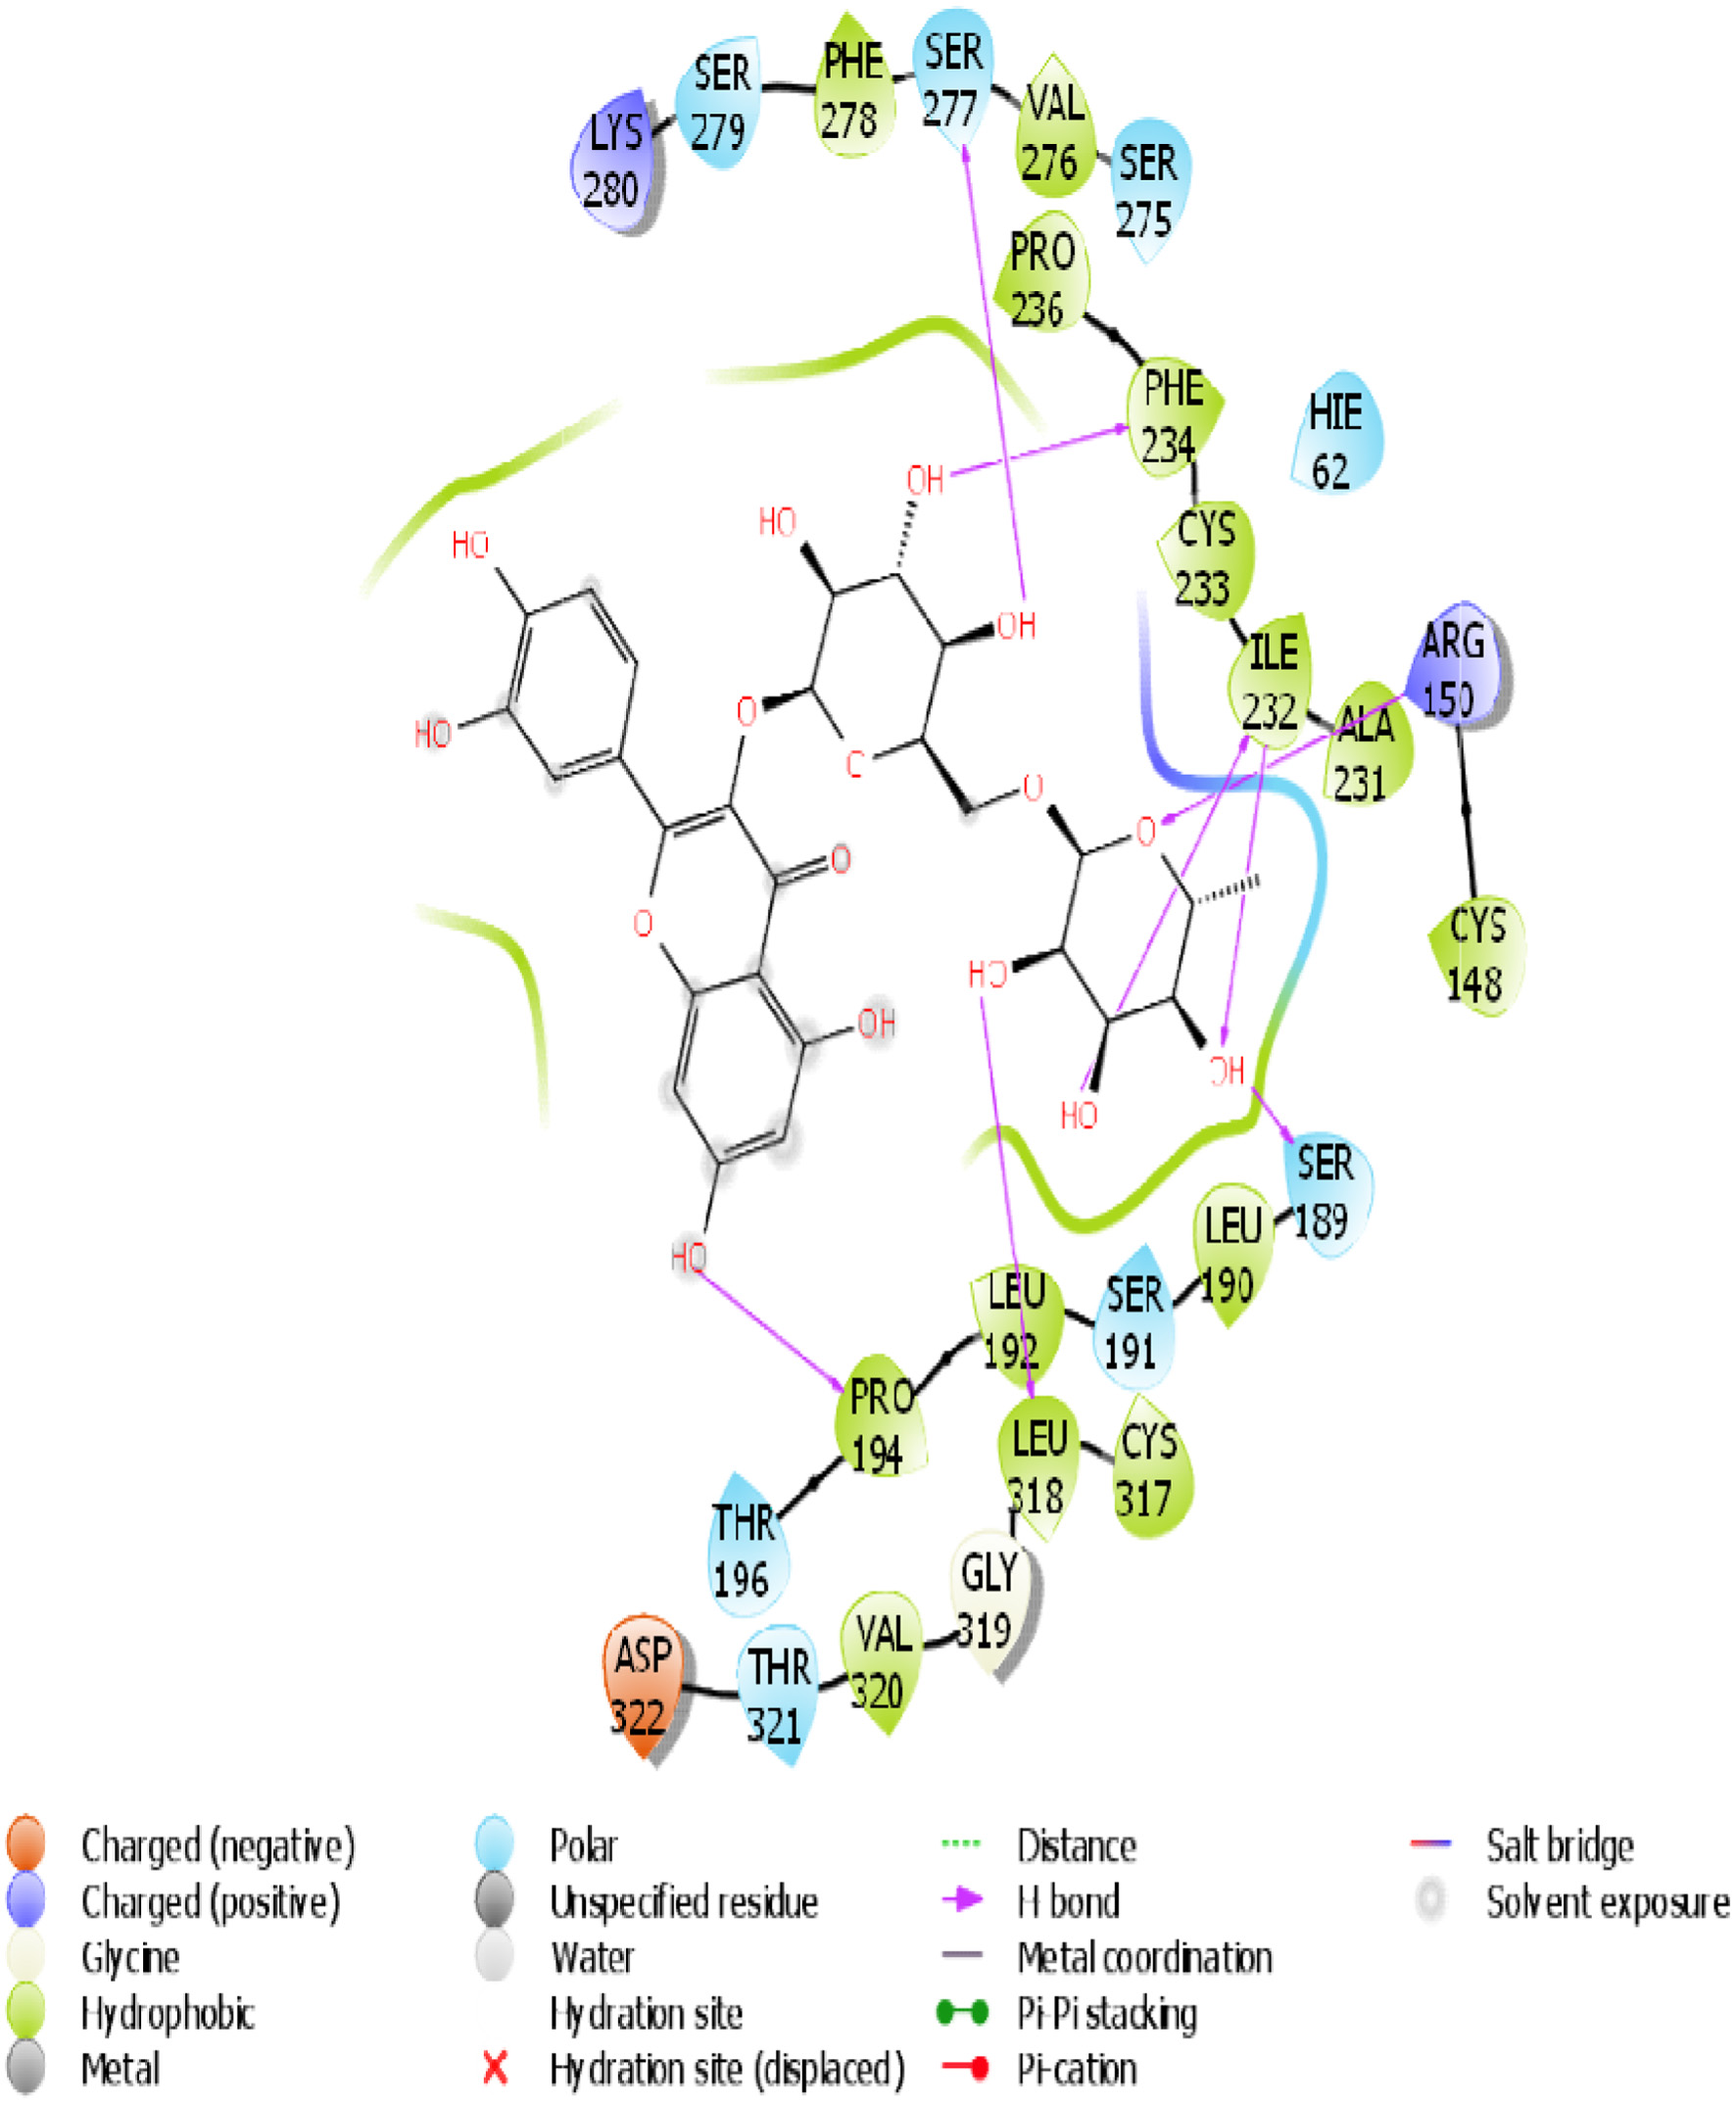
Figure 13. The 2D chemical relationship of Rutin with TGR5 with amino acid residues.
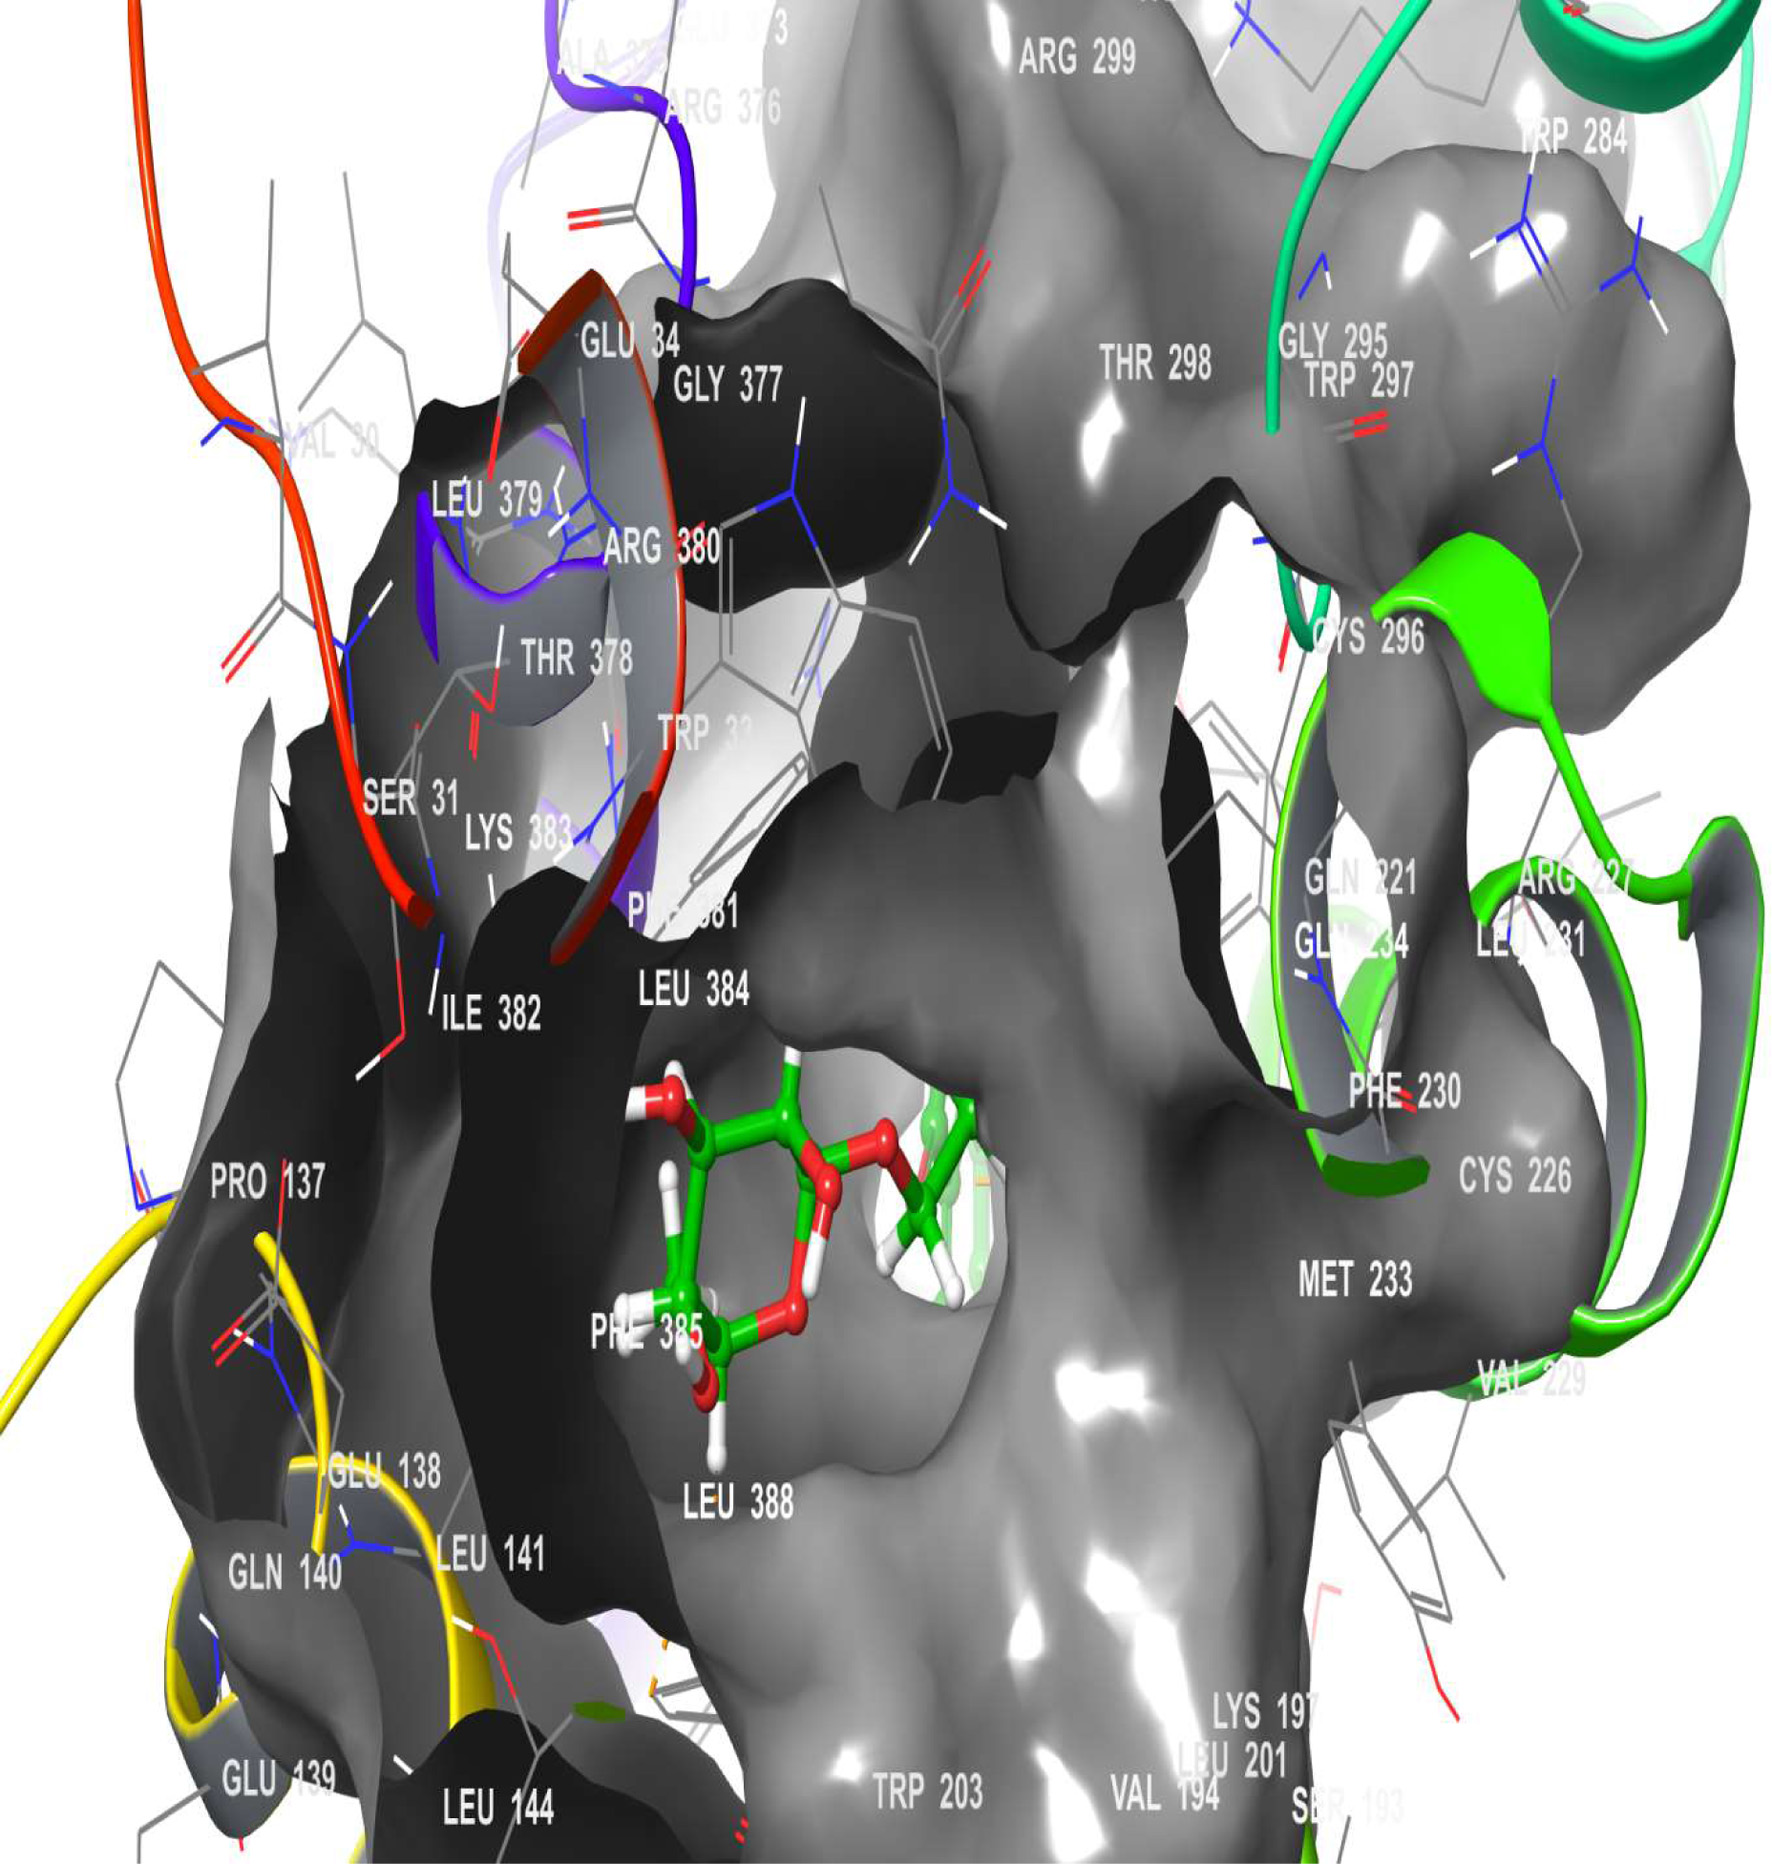
Figure 14. The 3D chemical relationship of Rutin with GLP-1 with amino acid residues.
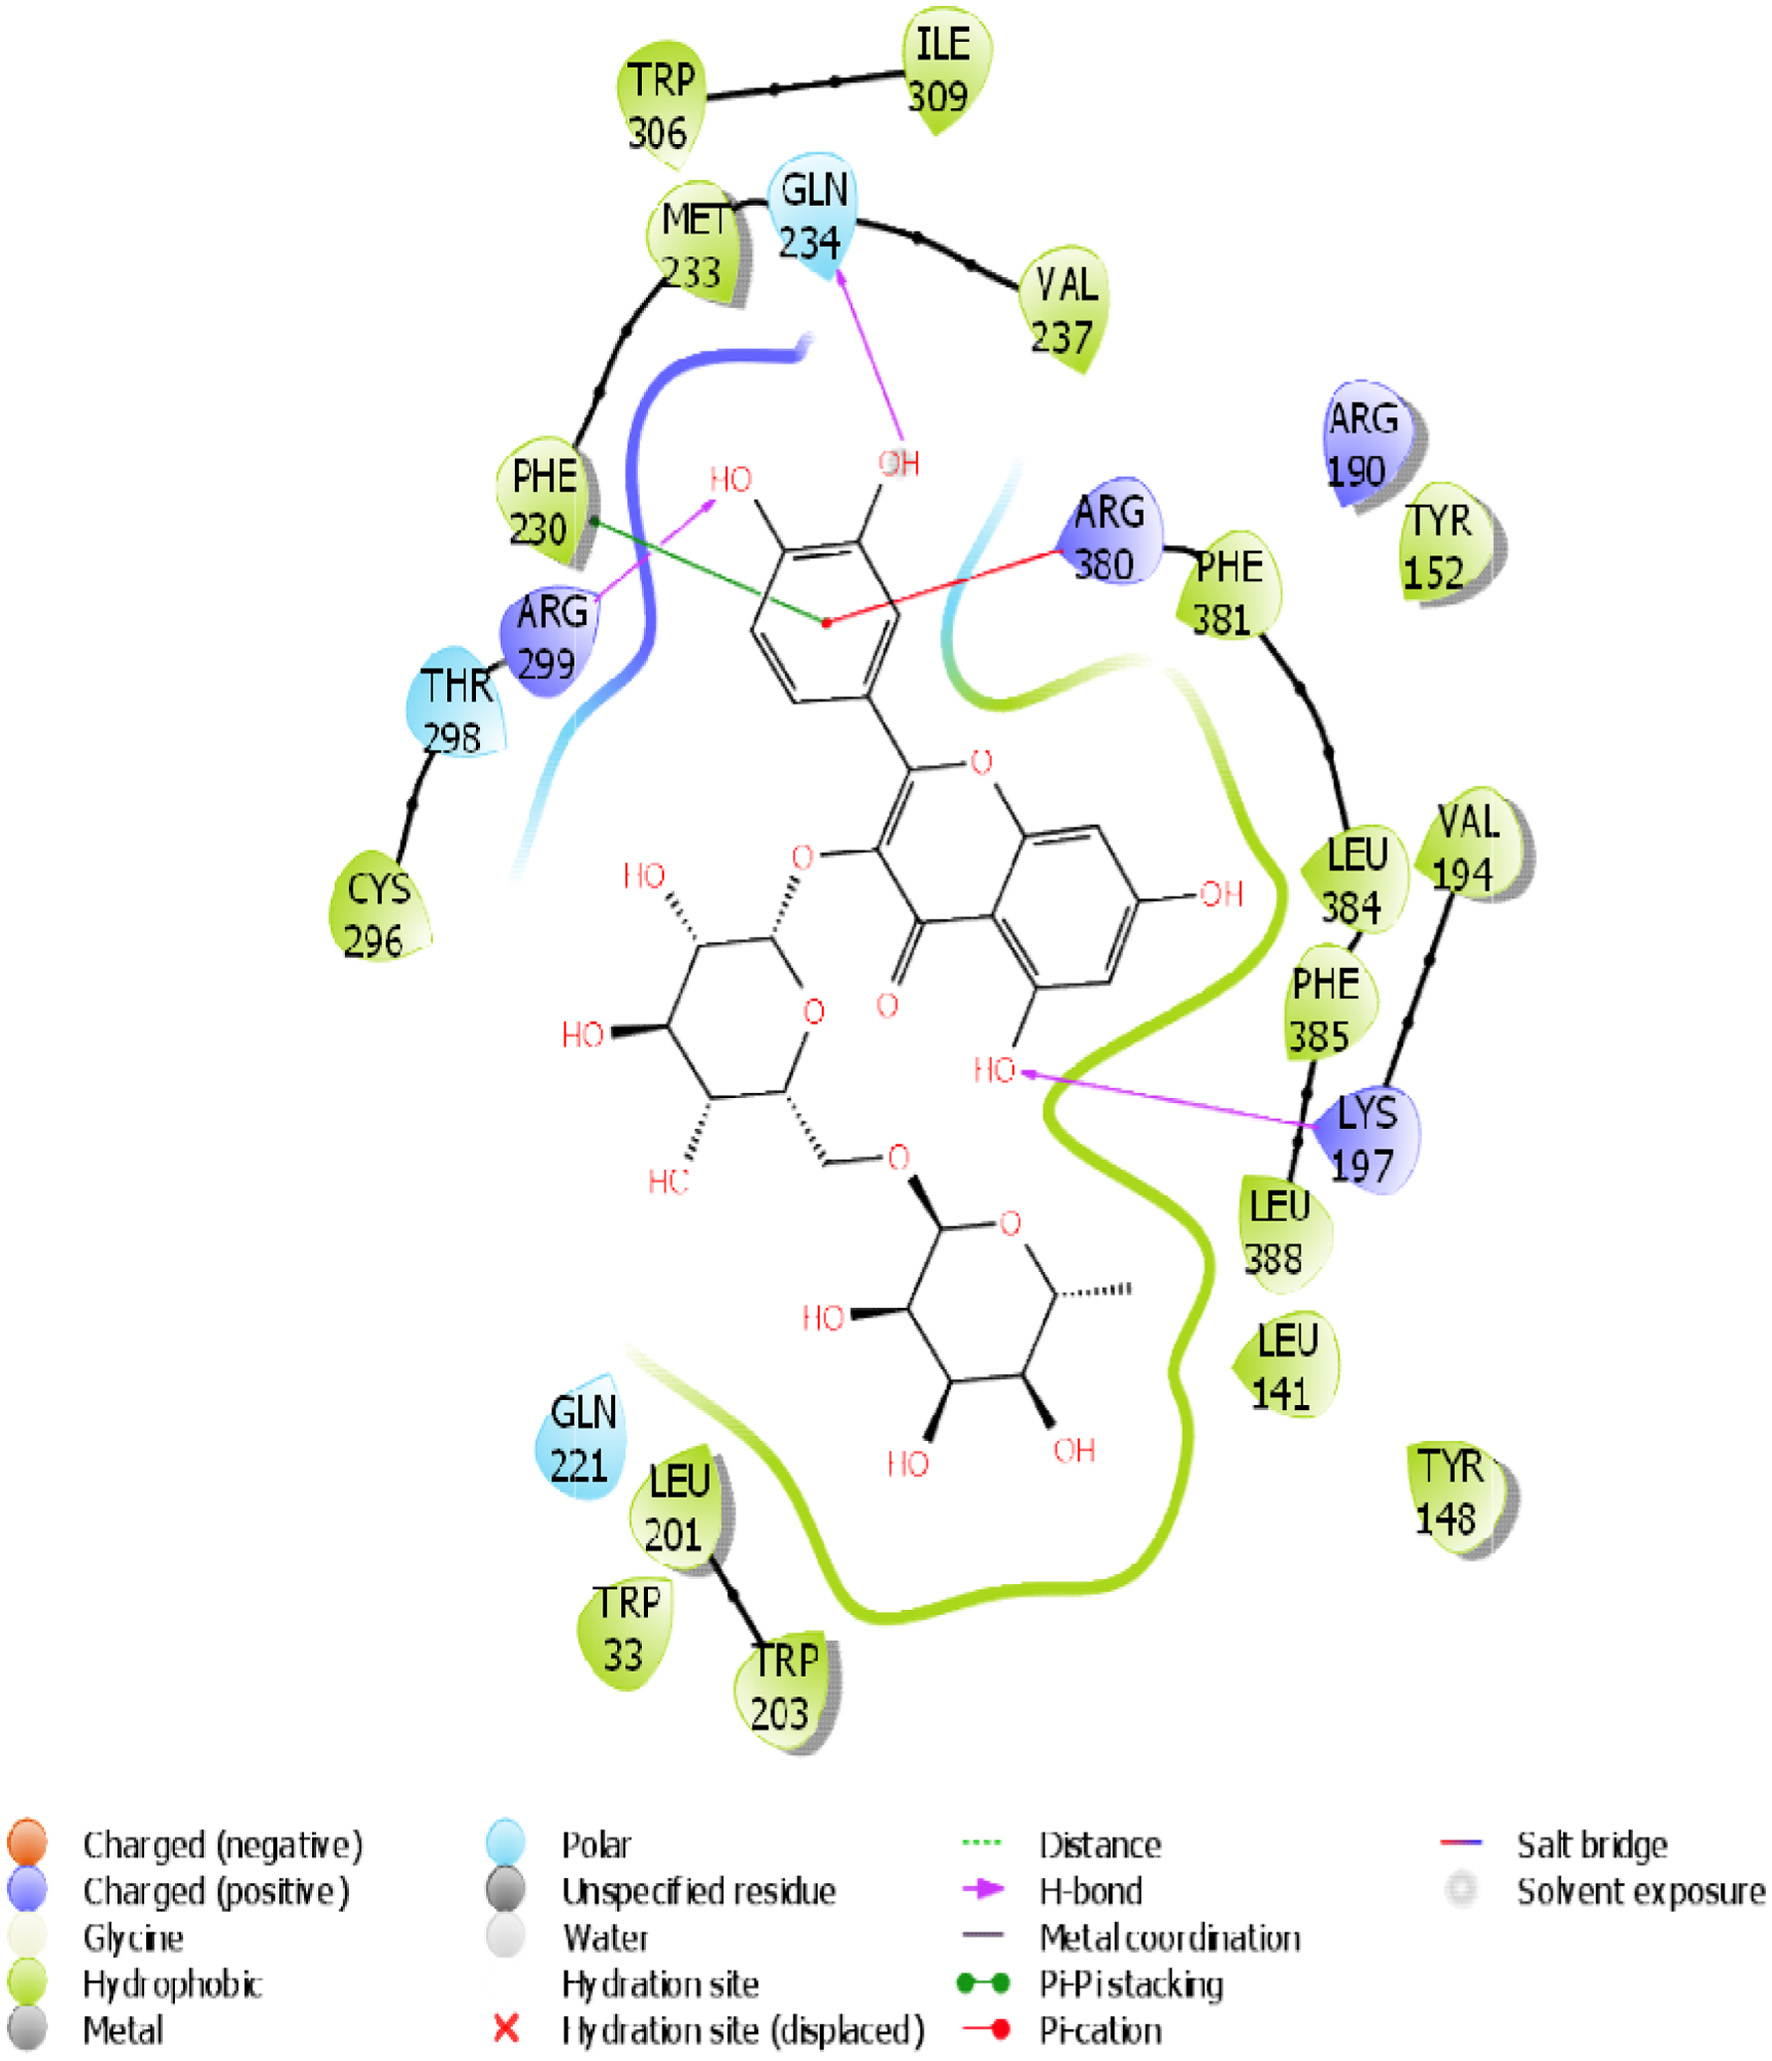
Figure 15. The 2D chemical relationship of Rutin with GLP-1 with amino acid residues.
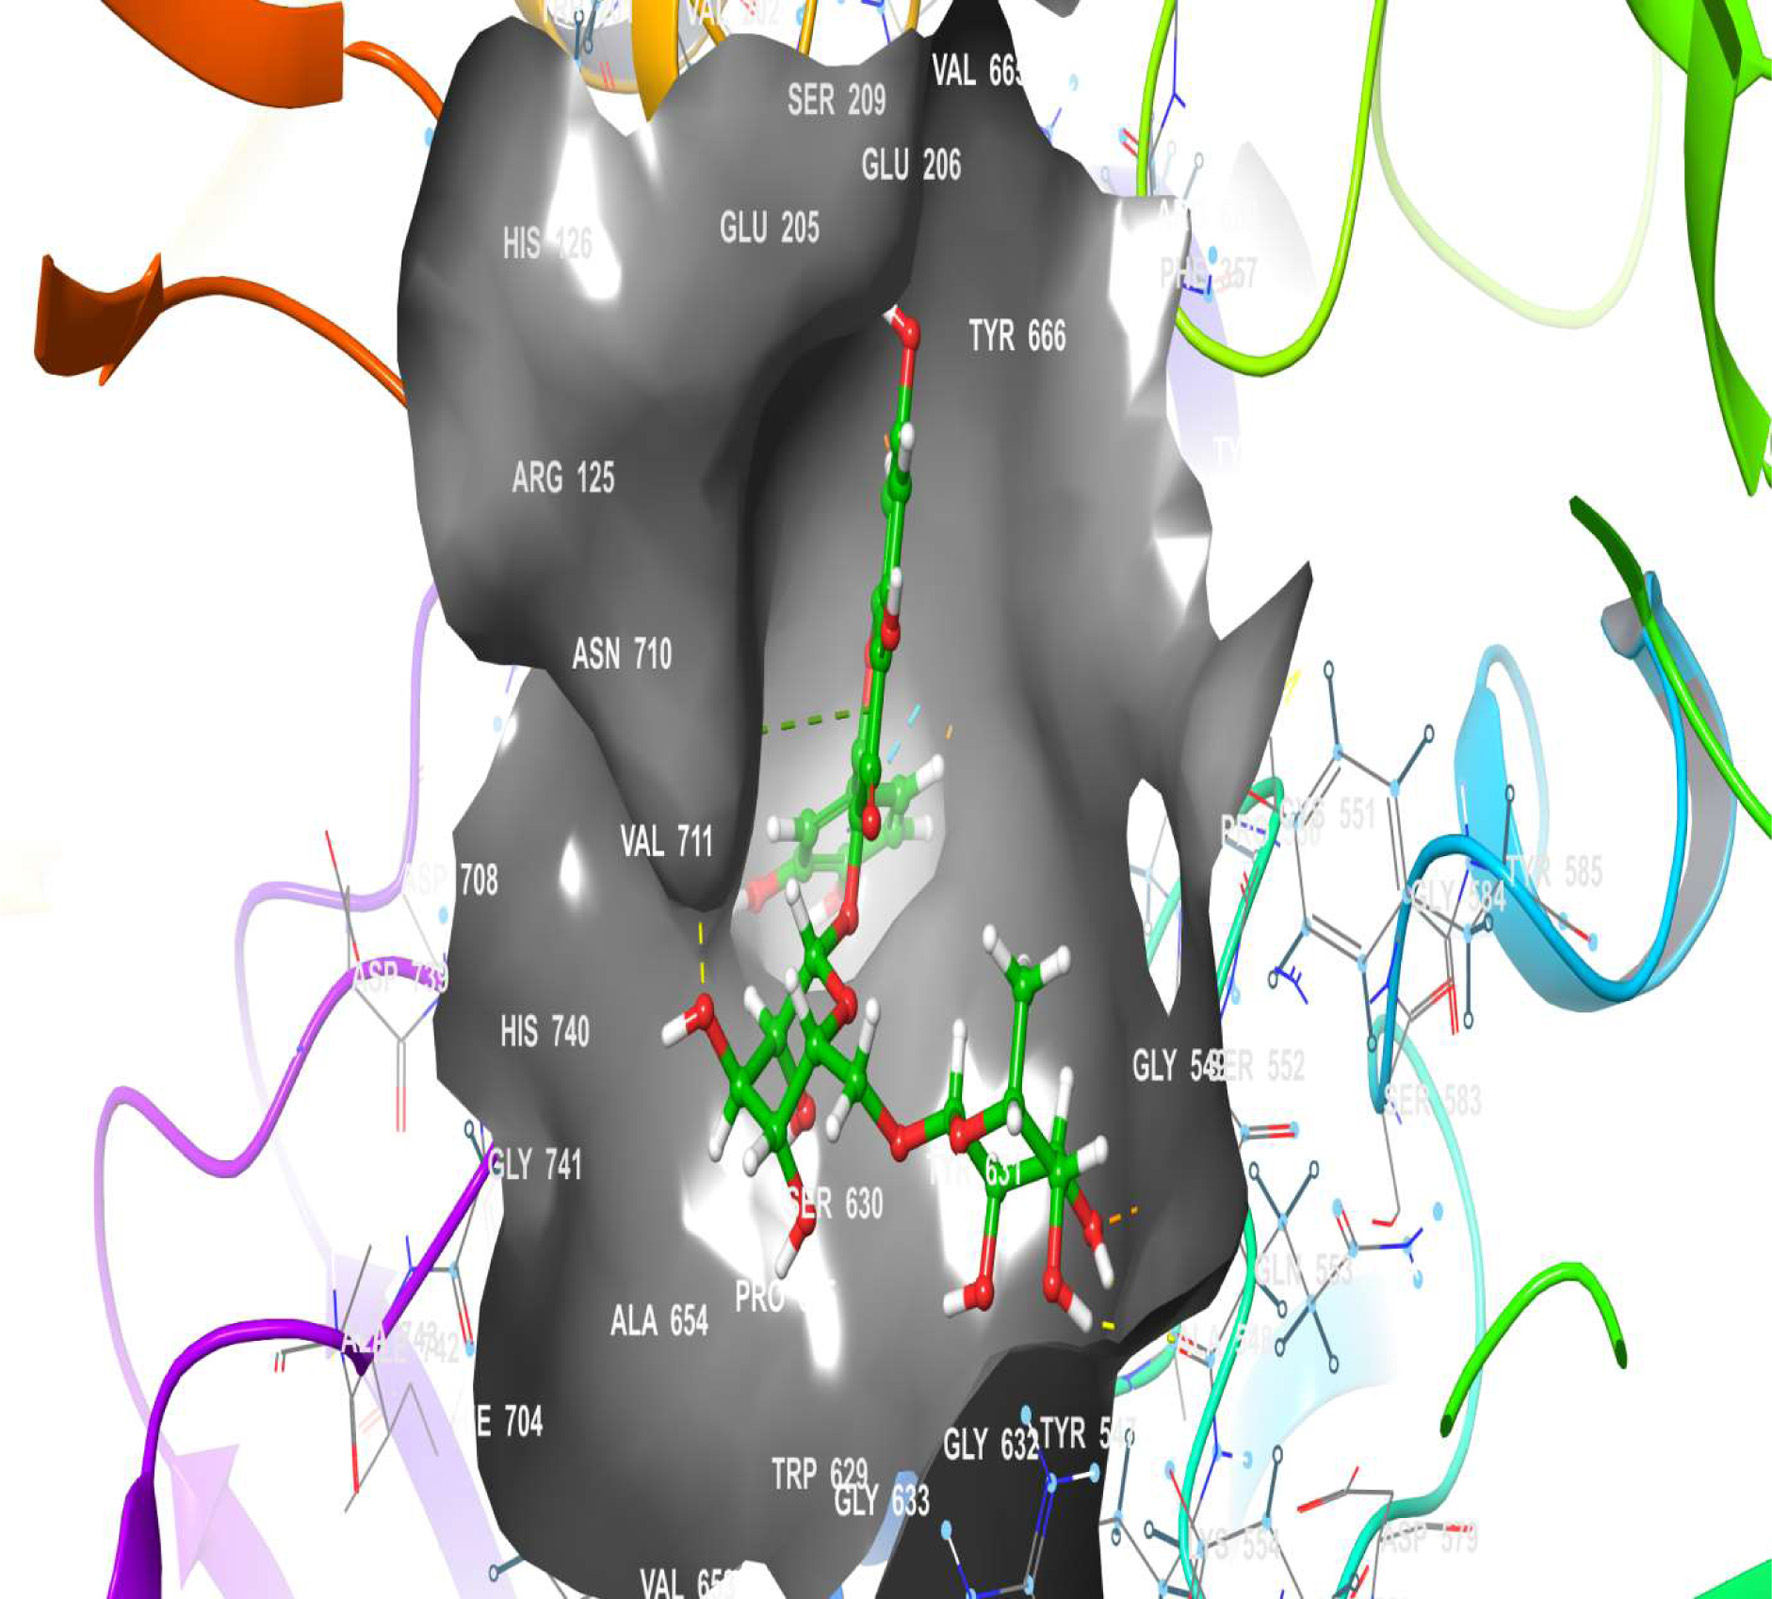
Figure 16. The 3D chemical relationship of Rutin with DPP4 with amino acid residues.
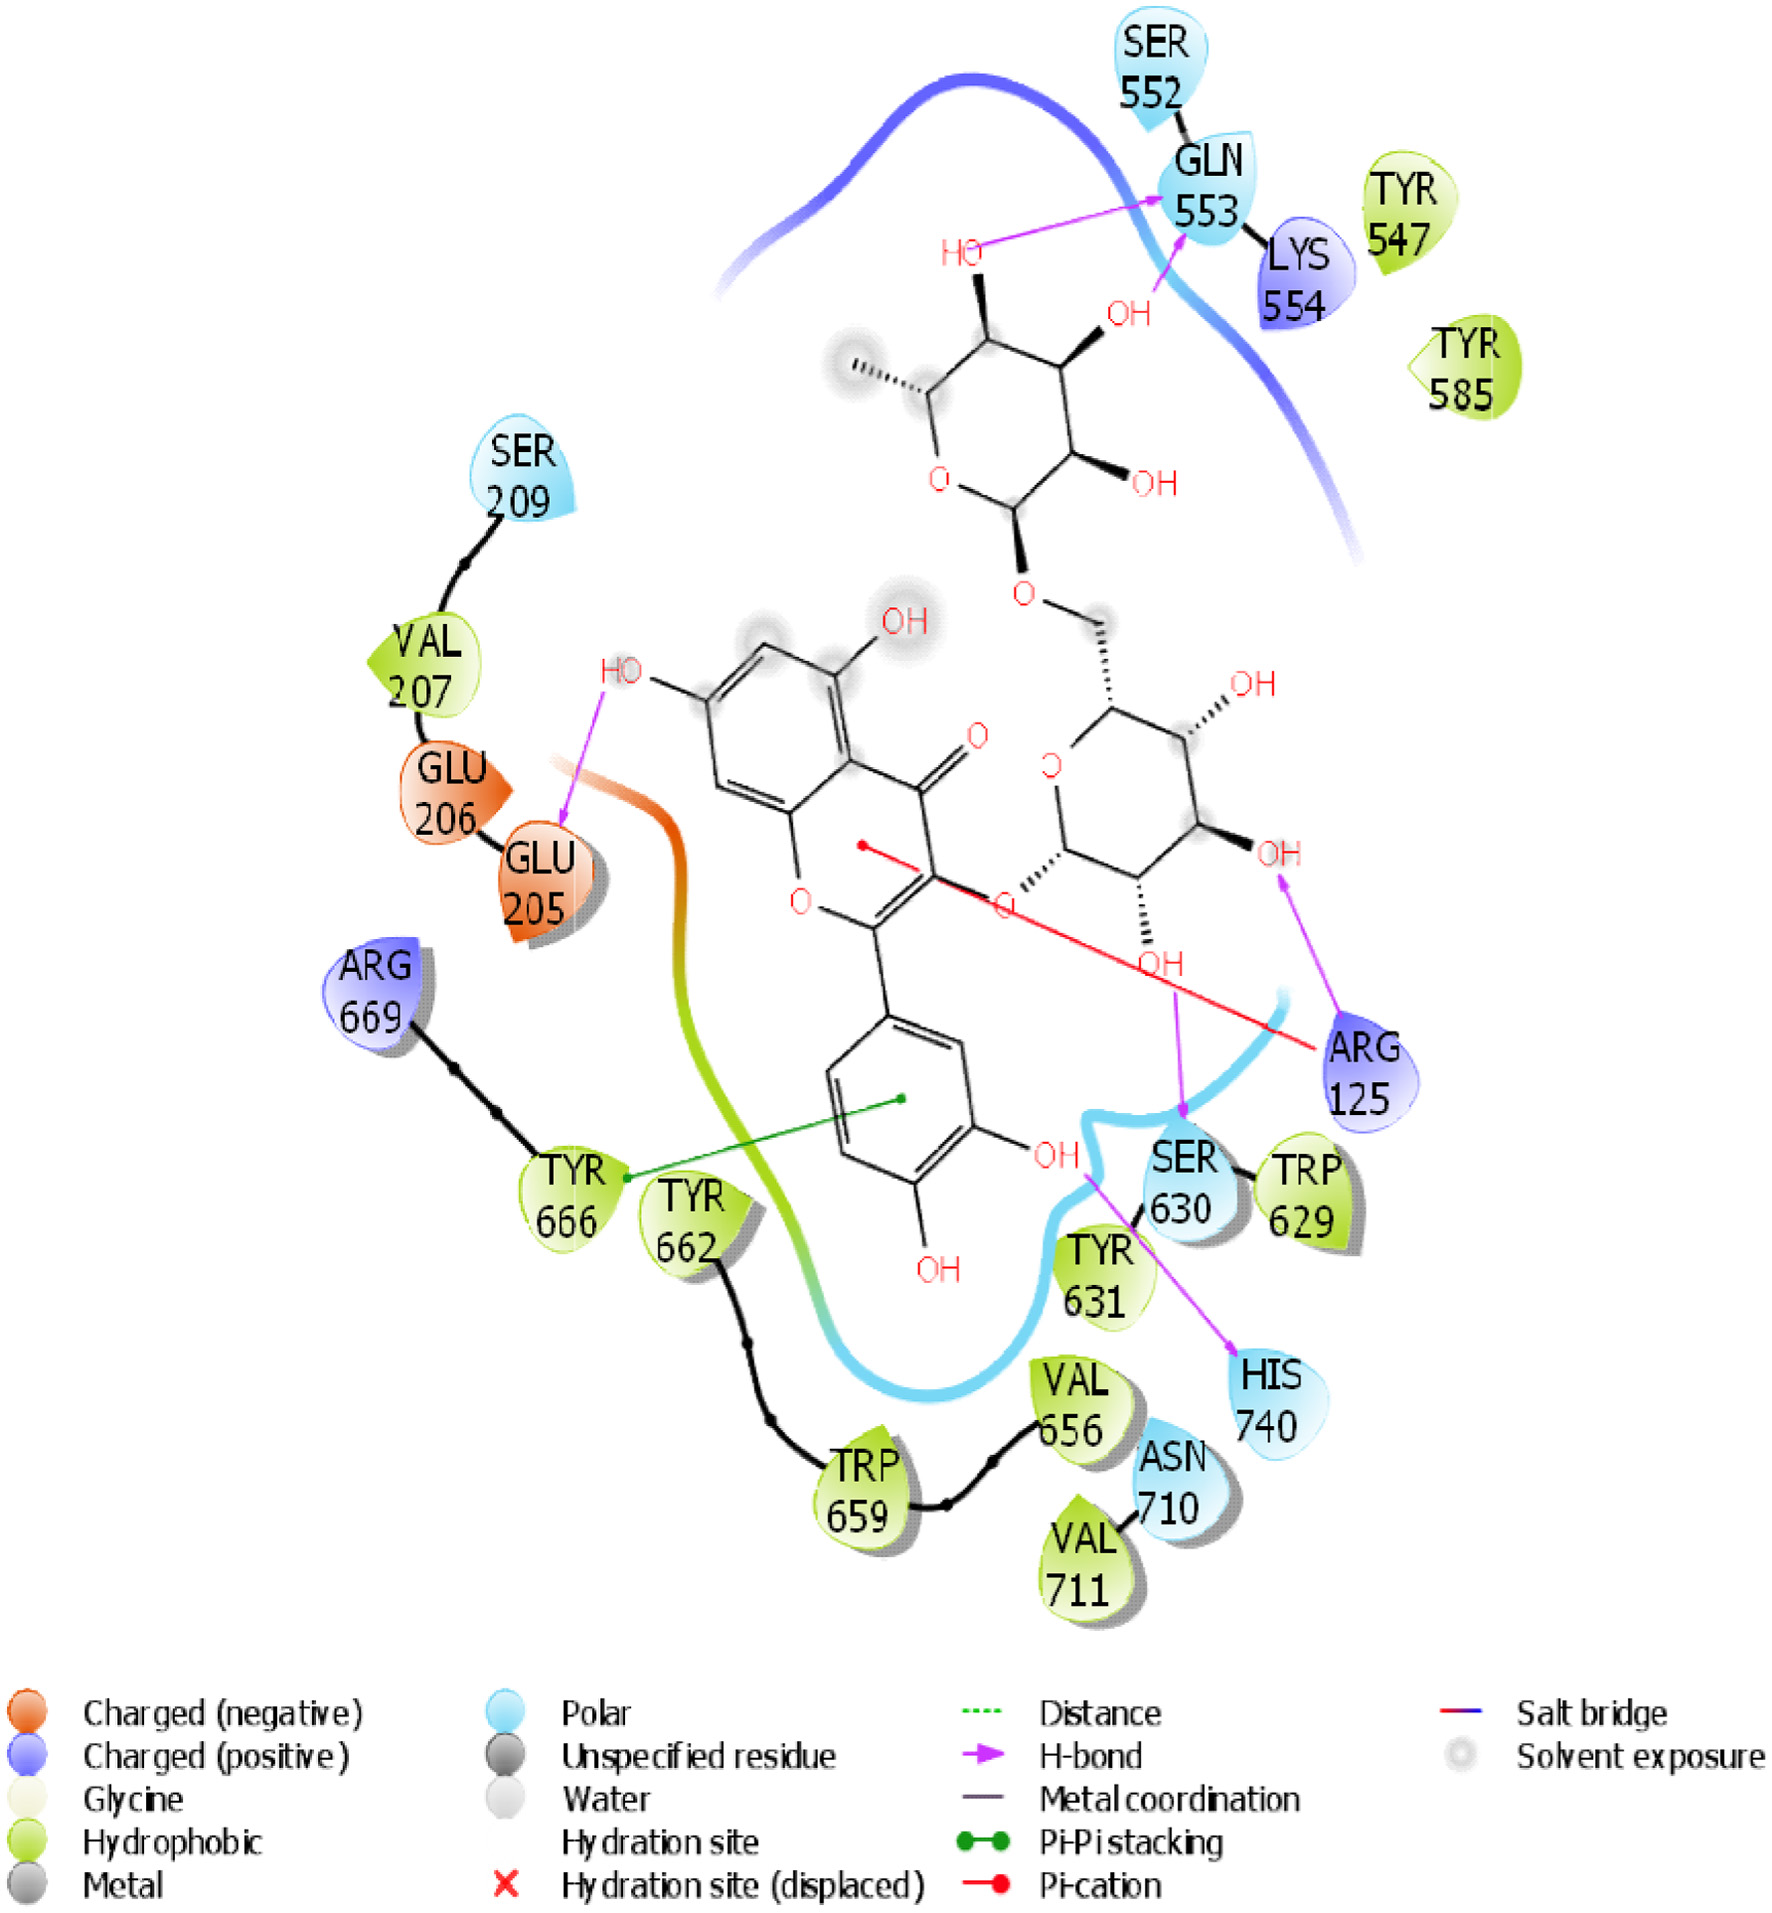
Figure 17. The 2D chemical relationship of Rutin with DPP4 with amino acid residues.
Tables
Table 1. Gene expression primer sets
| Gene | Forward primers | Reverse primers |
|---|
| PDX-1 | 5′-CCTTTCCCGAATGGAACCGA-3′ | 5′-GTATGCACCTCCTGCCCAC-3′ |
| TGR-5 | 5′-TGTCACACAACACCACTGAG-3′ | 5′-CAAGCAGGGAGAGGAAACAA-3′ |
| GLP-1 | 5′-TCCCAAAGGAGCTCCACCTG-3′ | 5′-TTCTCCTCCGTGTCTTGAGGG-3′ |
| DPP-4 | 5′-GCAAGACGTGGGTAATGATG- 3′ | 5′-AGCCTGGTTGGGTTTGTATG-3′ |
| TNFα | 5′-ACCACGCTCTTCTGTCTACTG-3′ | 5′-CTTGGTGGTTTGCTACGAC-3′ |
| IL-6 | 5′-TCTCTCCGCAAGAGACTTCCA-3′ | 5′-ATACTGGTCTGTTGTGGGTGG-3′ |
| IL-1β | 5′-CCGGATGGGTAGGATAAAGTT-3′ | 5′-ACCCACTGAGGTAGGAAAGA-3′ |
| GAPDH | 5′-AGACAGCCGCATCTTCTTGT-3′ | 5′-CTTGCCGTGGGTAGAGTCAT-3′ |
Table 2. Binding affinity, H-bonding, and hydrophobic interactions of rutin with selected receptor targets
| No | Receptors and Rutin | Hydrogen Bonding | No of Pi-Pi links | Docking score (kcal/mol) | Binding Free Energy(kcal/mol) | Hydrophobic Interaction |
|---|
| 1 | GLP-1 | 3 (LYS 197, ARG 299, GLN 234) | 1 | -12.723 | -41.36 | 17 (TRP 306, ILE 309, MET 233, VAL 237, CYS 296…PHE 230) |
| 2 | TGR-5 | 7 (SER 277, PHE 234, ILE 232, ILE 232, ARG 150, LEU 318, PRO 194) | 0 | -12.407 | -42.87 | 13 (VAL 276, PHE 278, PHE 234, CYS 233, ILE 232 …PRO 236) |
| 3 | DPP4 | 6 (HIS 740, ARG 125, GLN 553, GLN 553, SER 630, GLU 205) | 1 | -10.218 | -50.58 | 10 (VAL 207, TYR 666, TYR 662, TRP 659, TYR 631, VAL 656, VAL 711, TRP 629, TYR 585, TYR 547) |