Figures
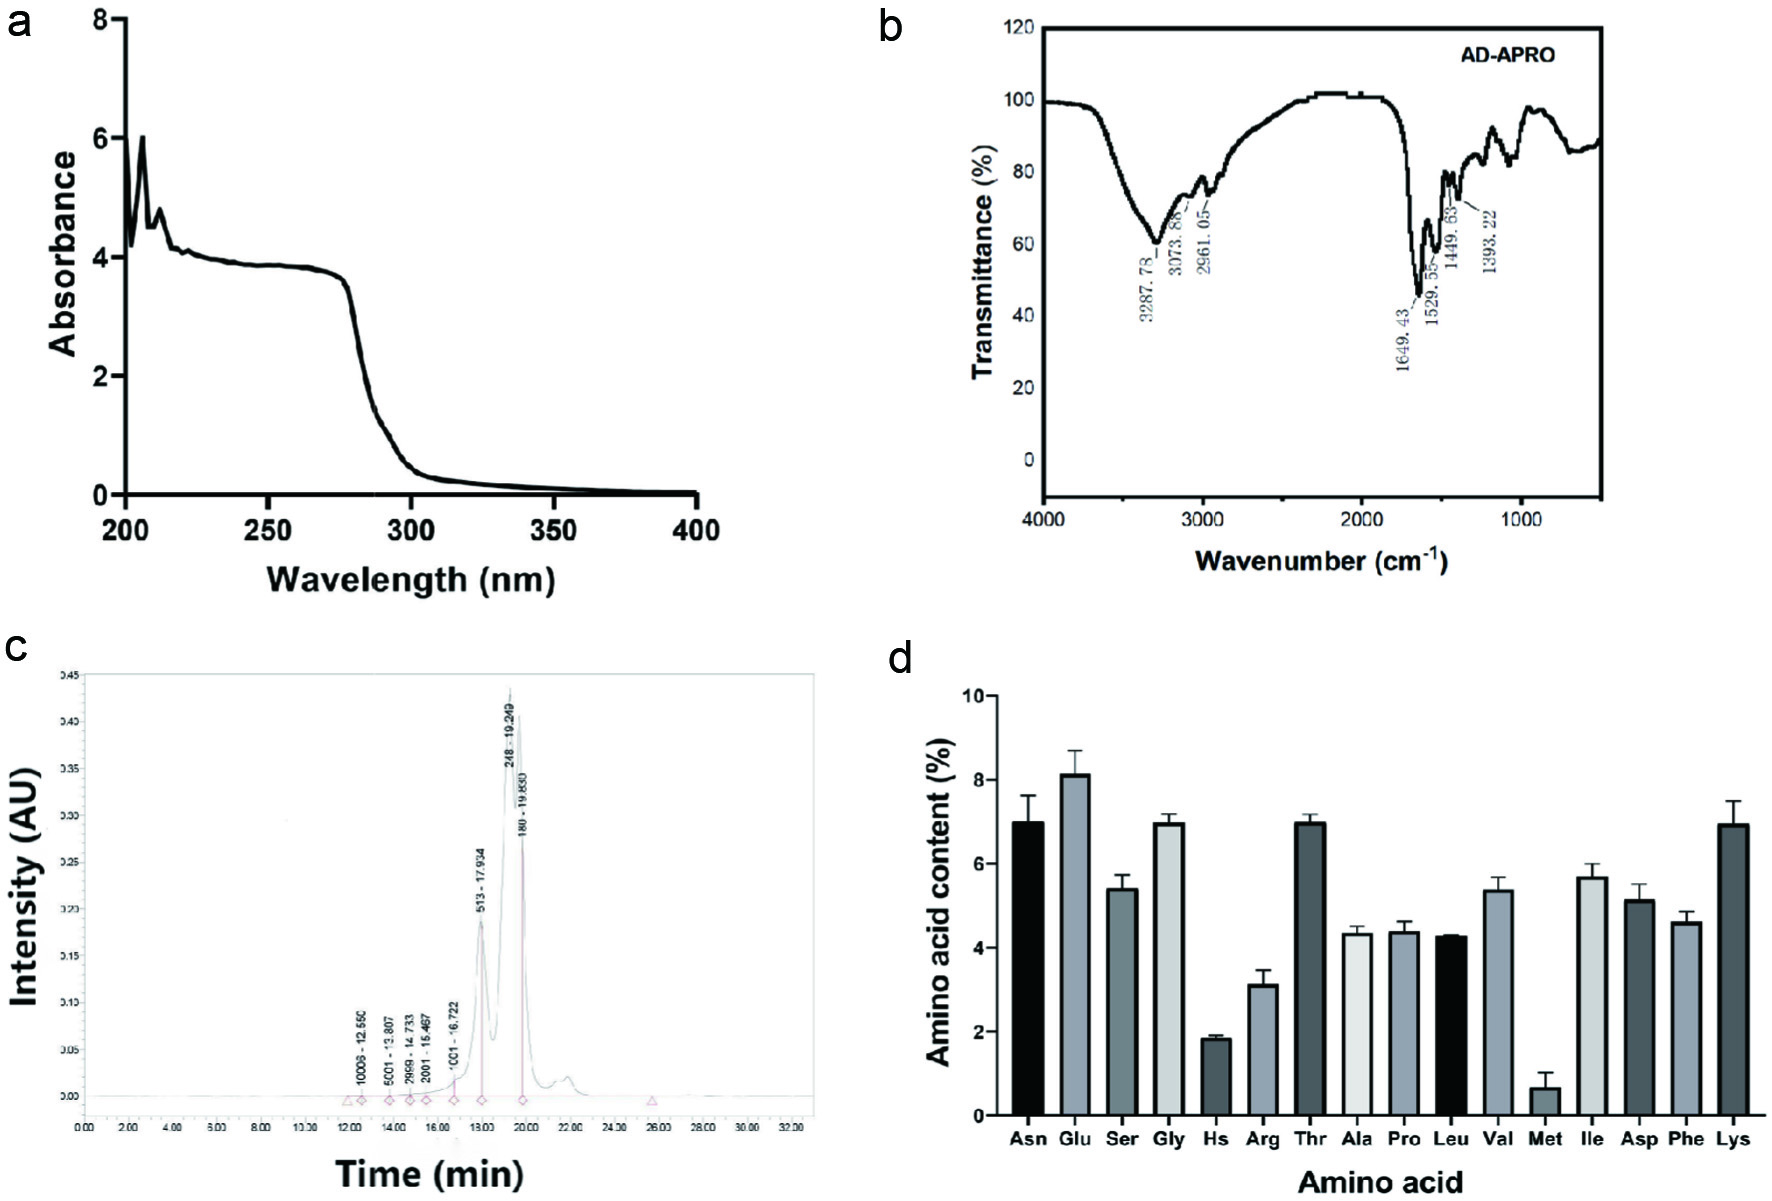
Figure 1. Characteristic of AD-APRO. (a) UV spectrum. (b) IR spectrum. (c) Gel Permeation Chromatography (GPC). (d) Animo acid.
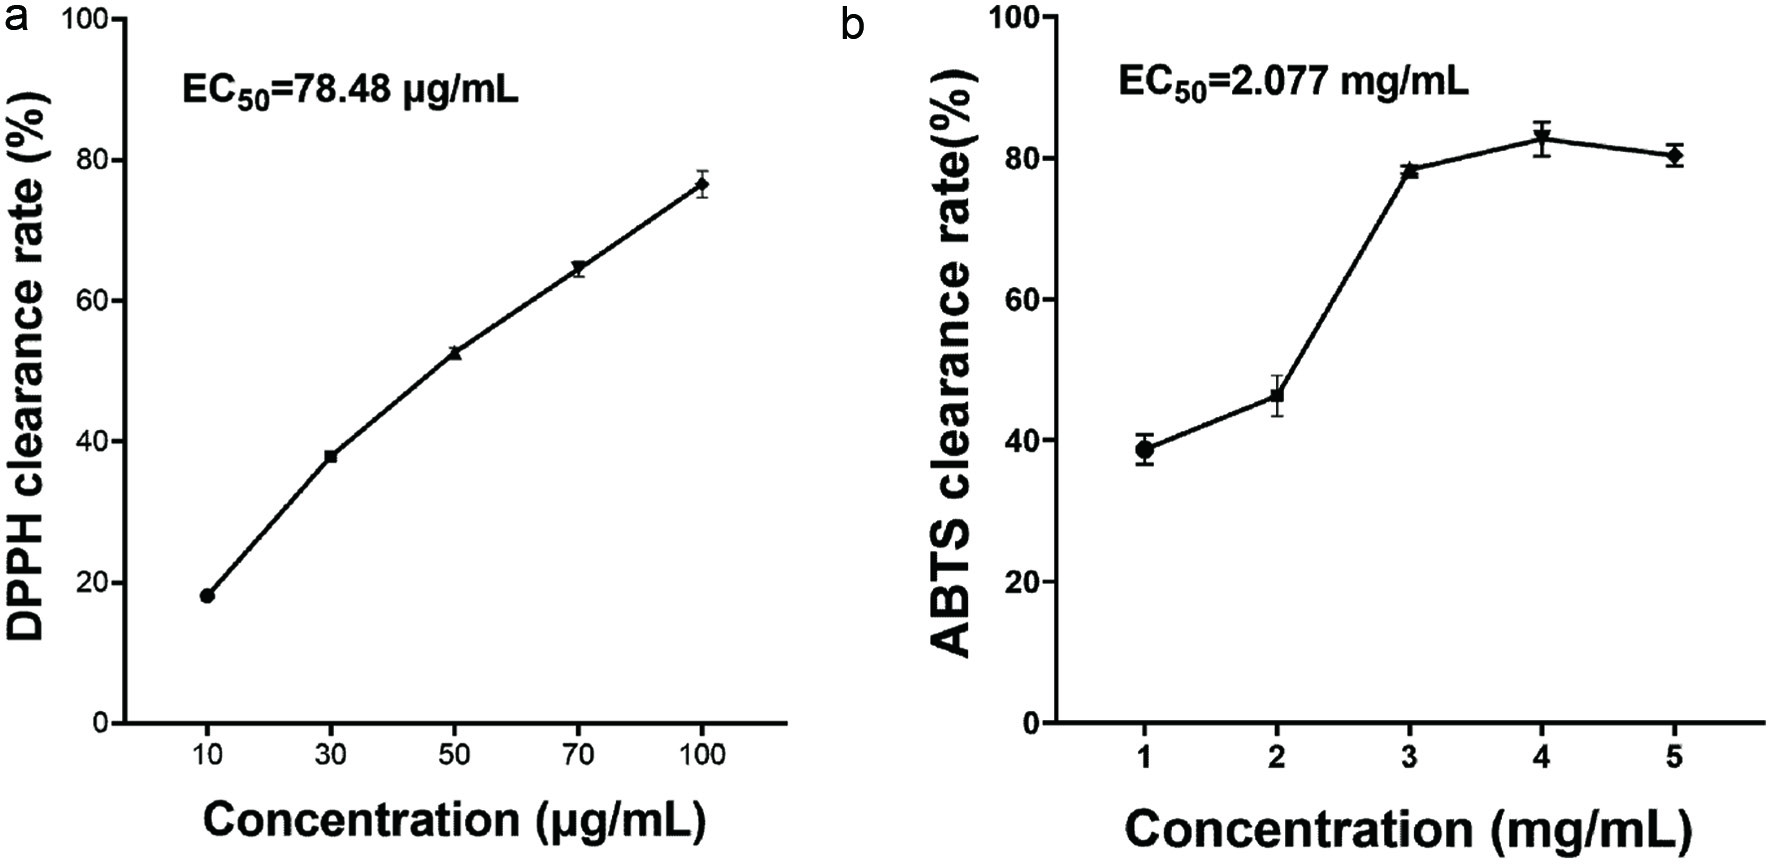
Figure 2. Antioxidant activity of AD-APRO in vitro. (a) DPPH radical scavenging rate of AD-APRO. (b) ABTS radical scavenging rate of AD-APRO.
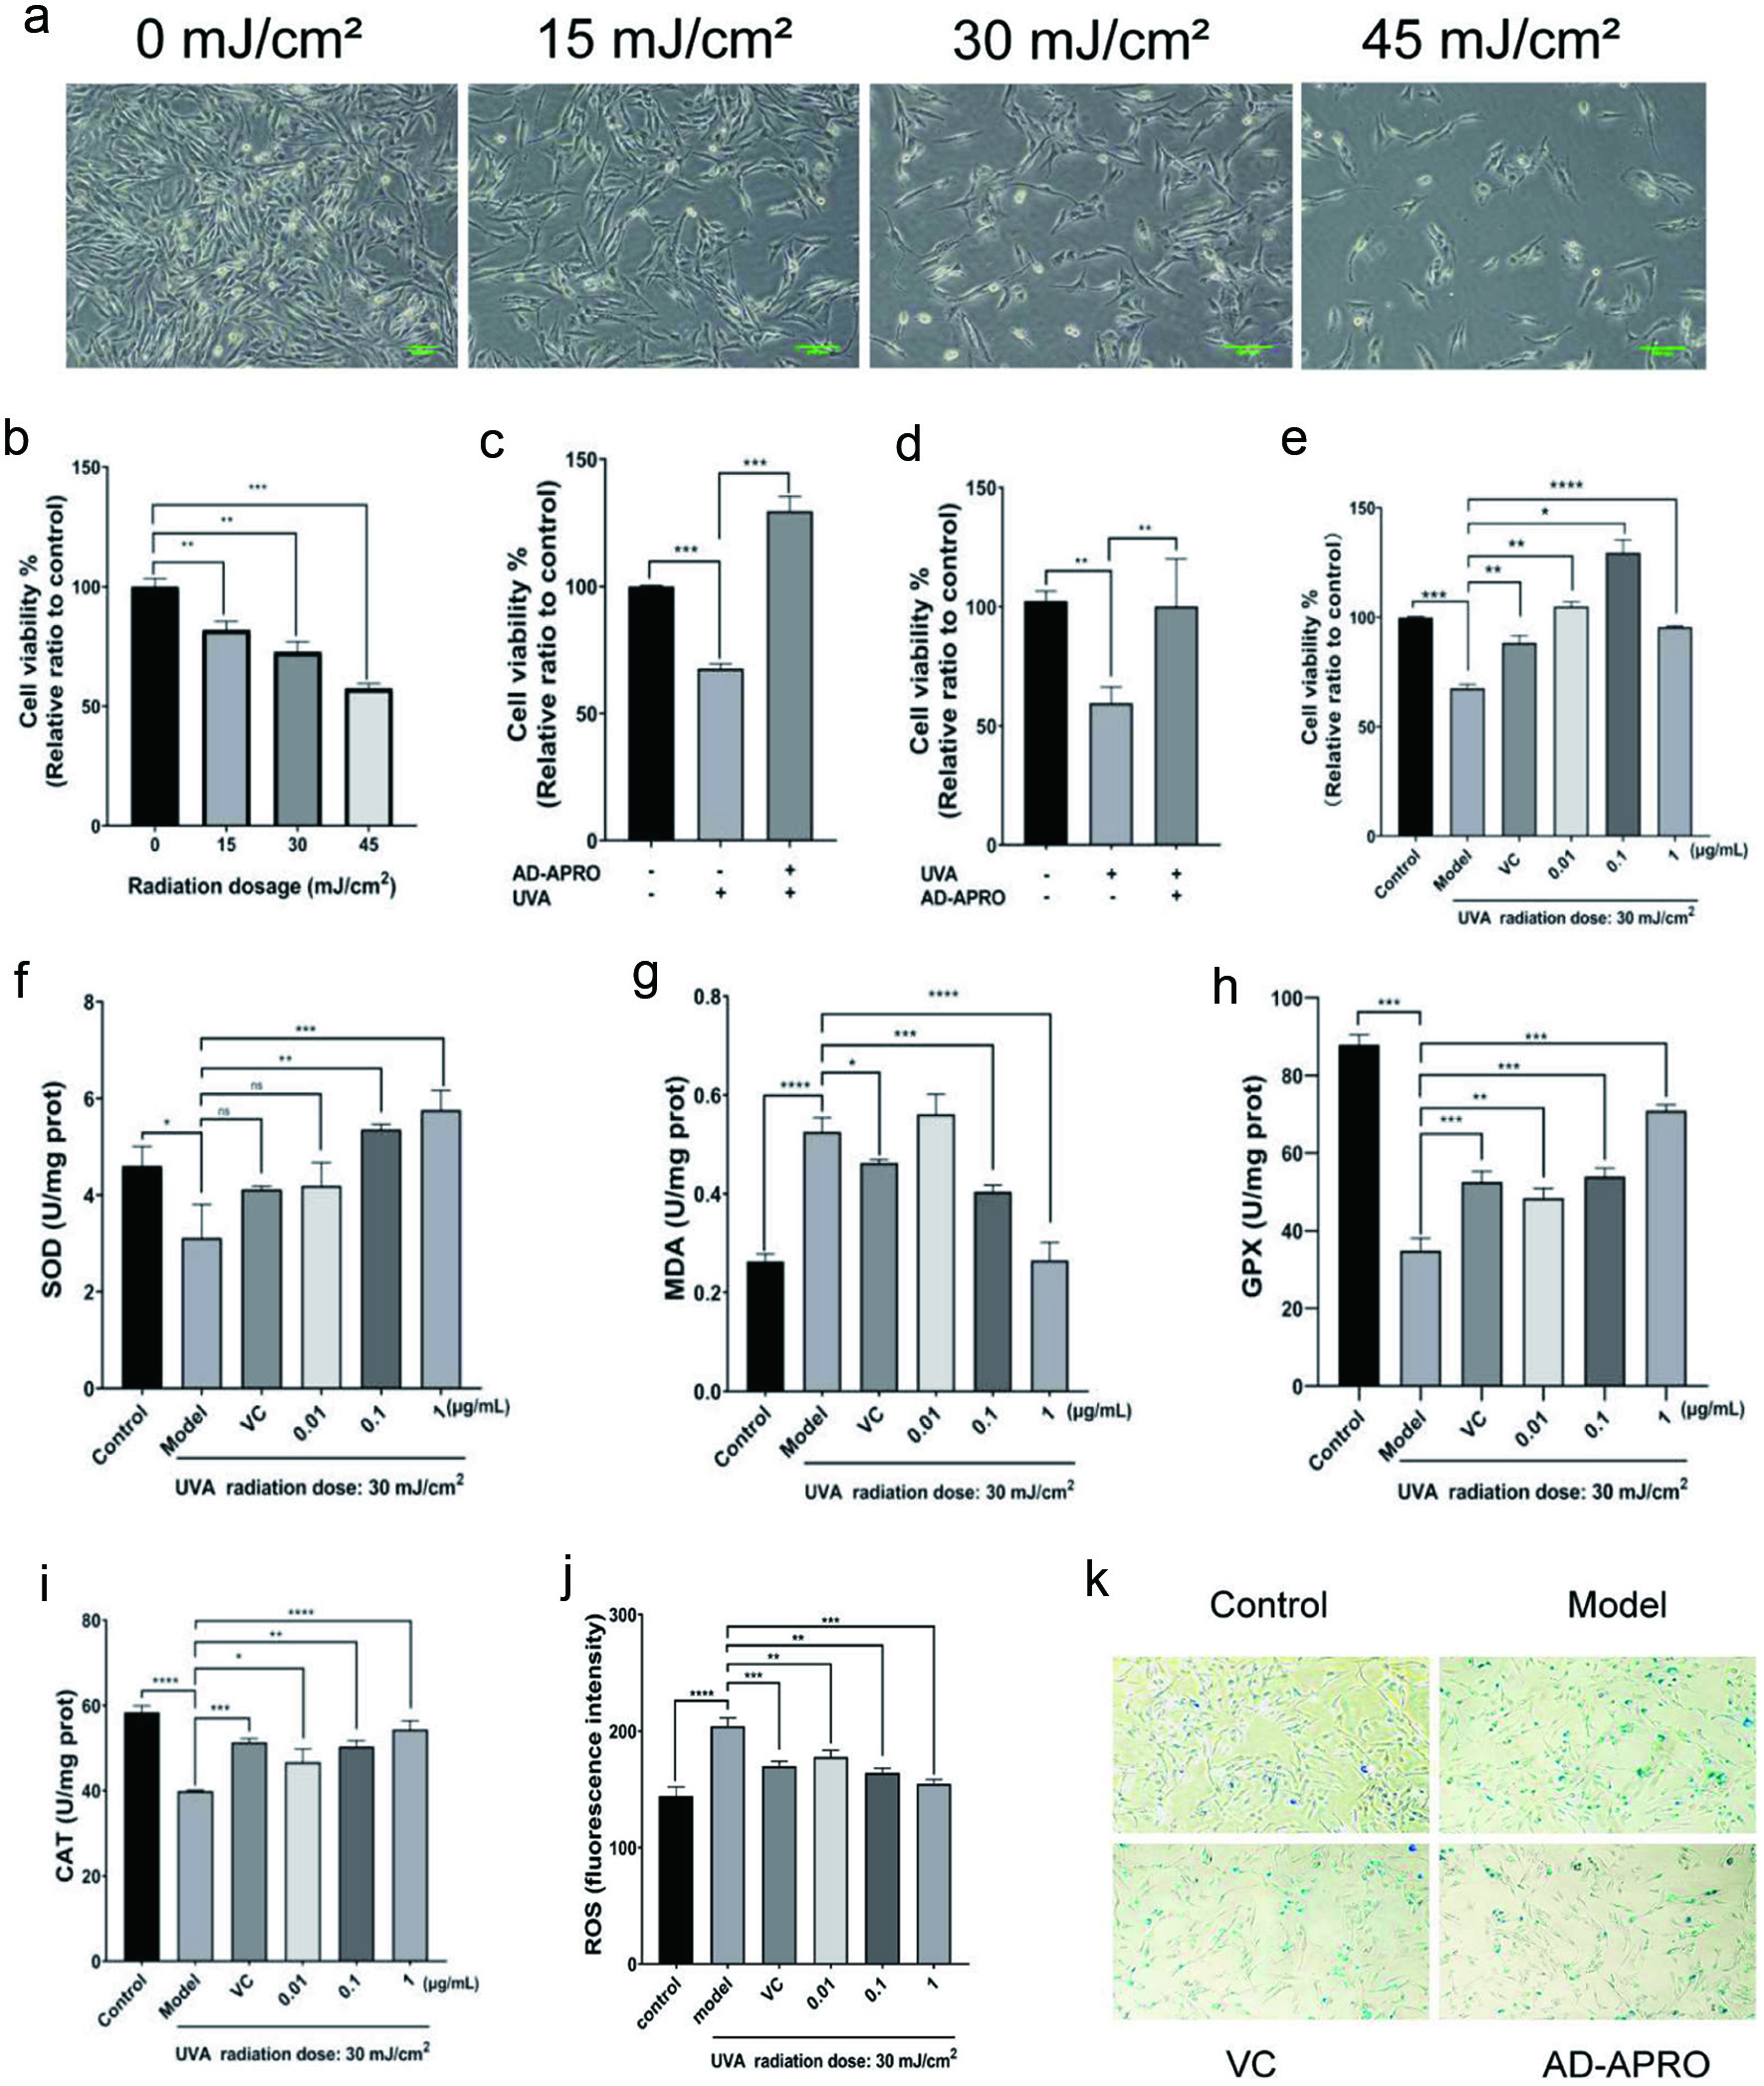
Figure 3. AD-APRO alleviates the damage of HSF cells caused by photoaging. (a) Cell morphology. (b–e) Cell viability. (f–j) Activity and content of SOD, MDA, GPX, CAT. (k) β-Gal staining.
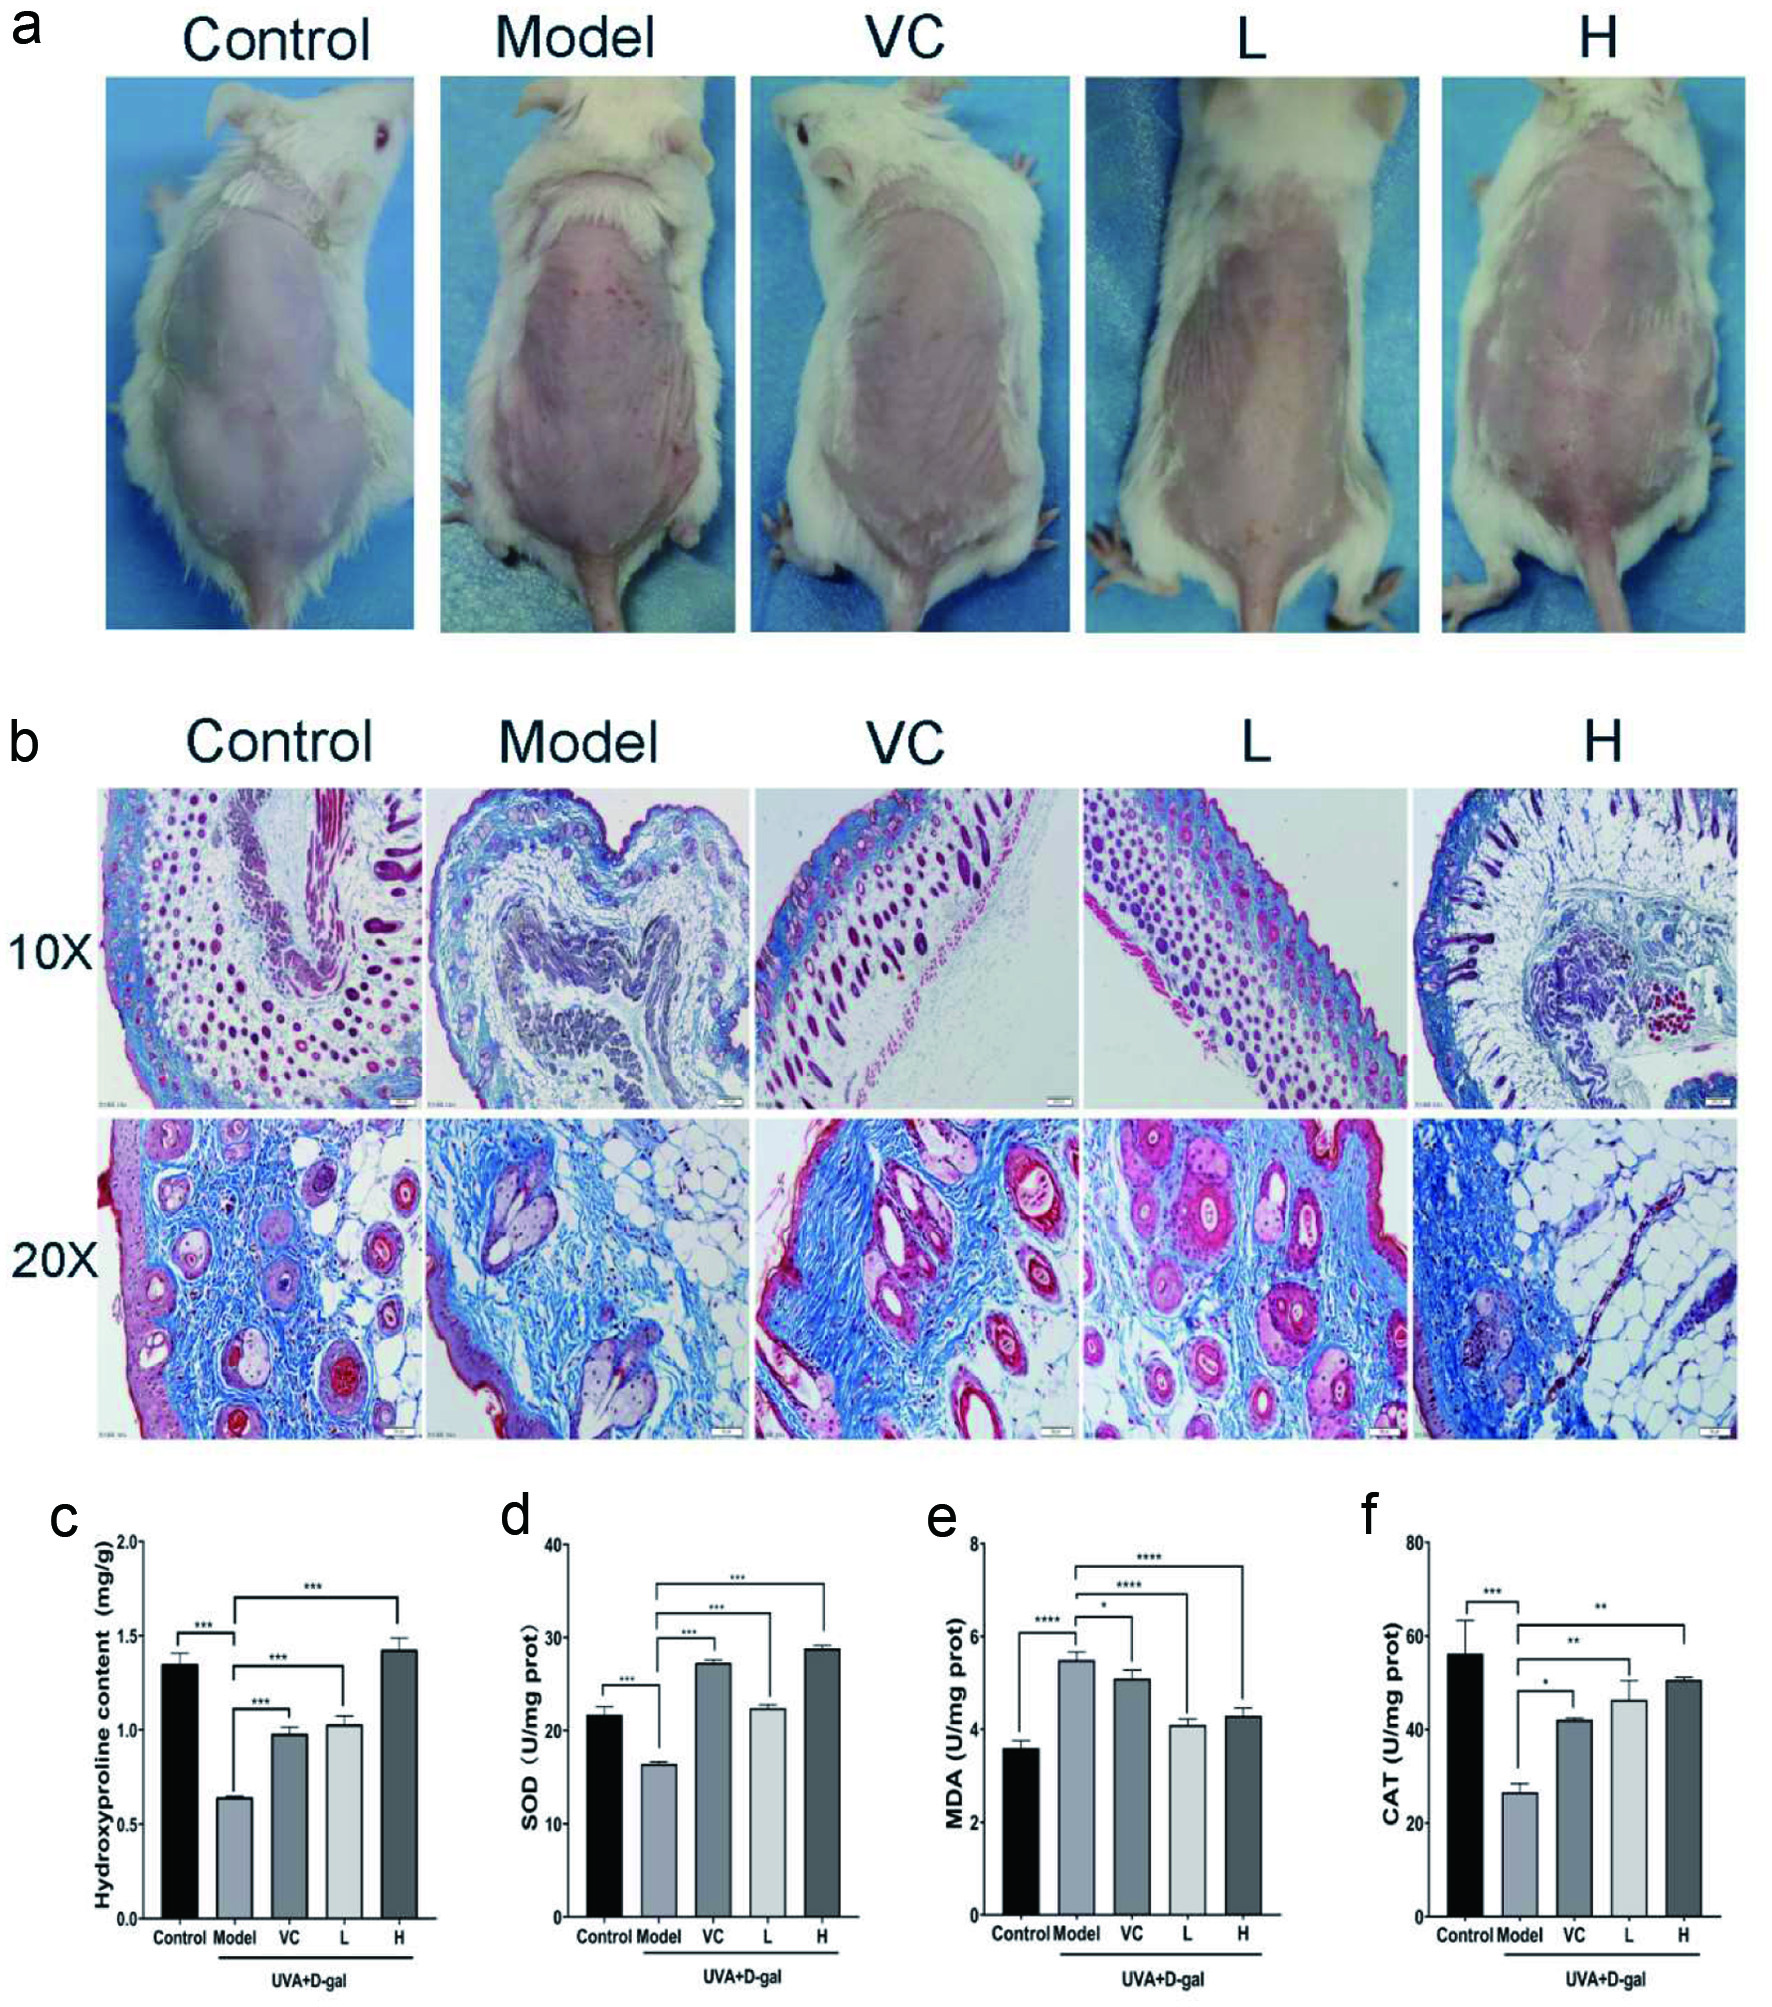
Figure 4. The effect of AD-APRO on mouse skin aging induced by UVA combined with D-galactose. (a) The surface examination of dorsal skin. (b) MASOON staining of skin tissue. (c–f) Measurement of HYP, SOD, MDA, CAT.
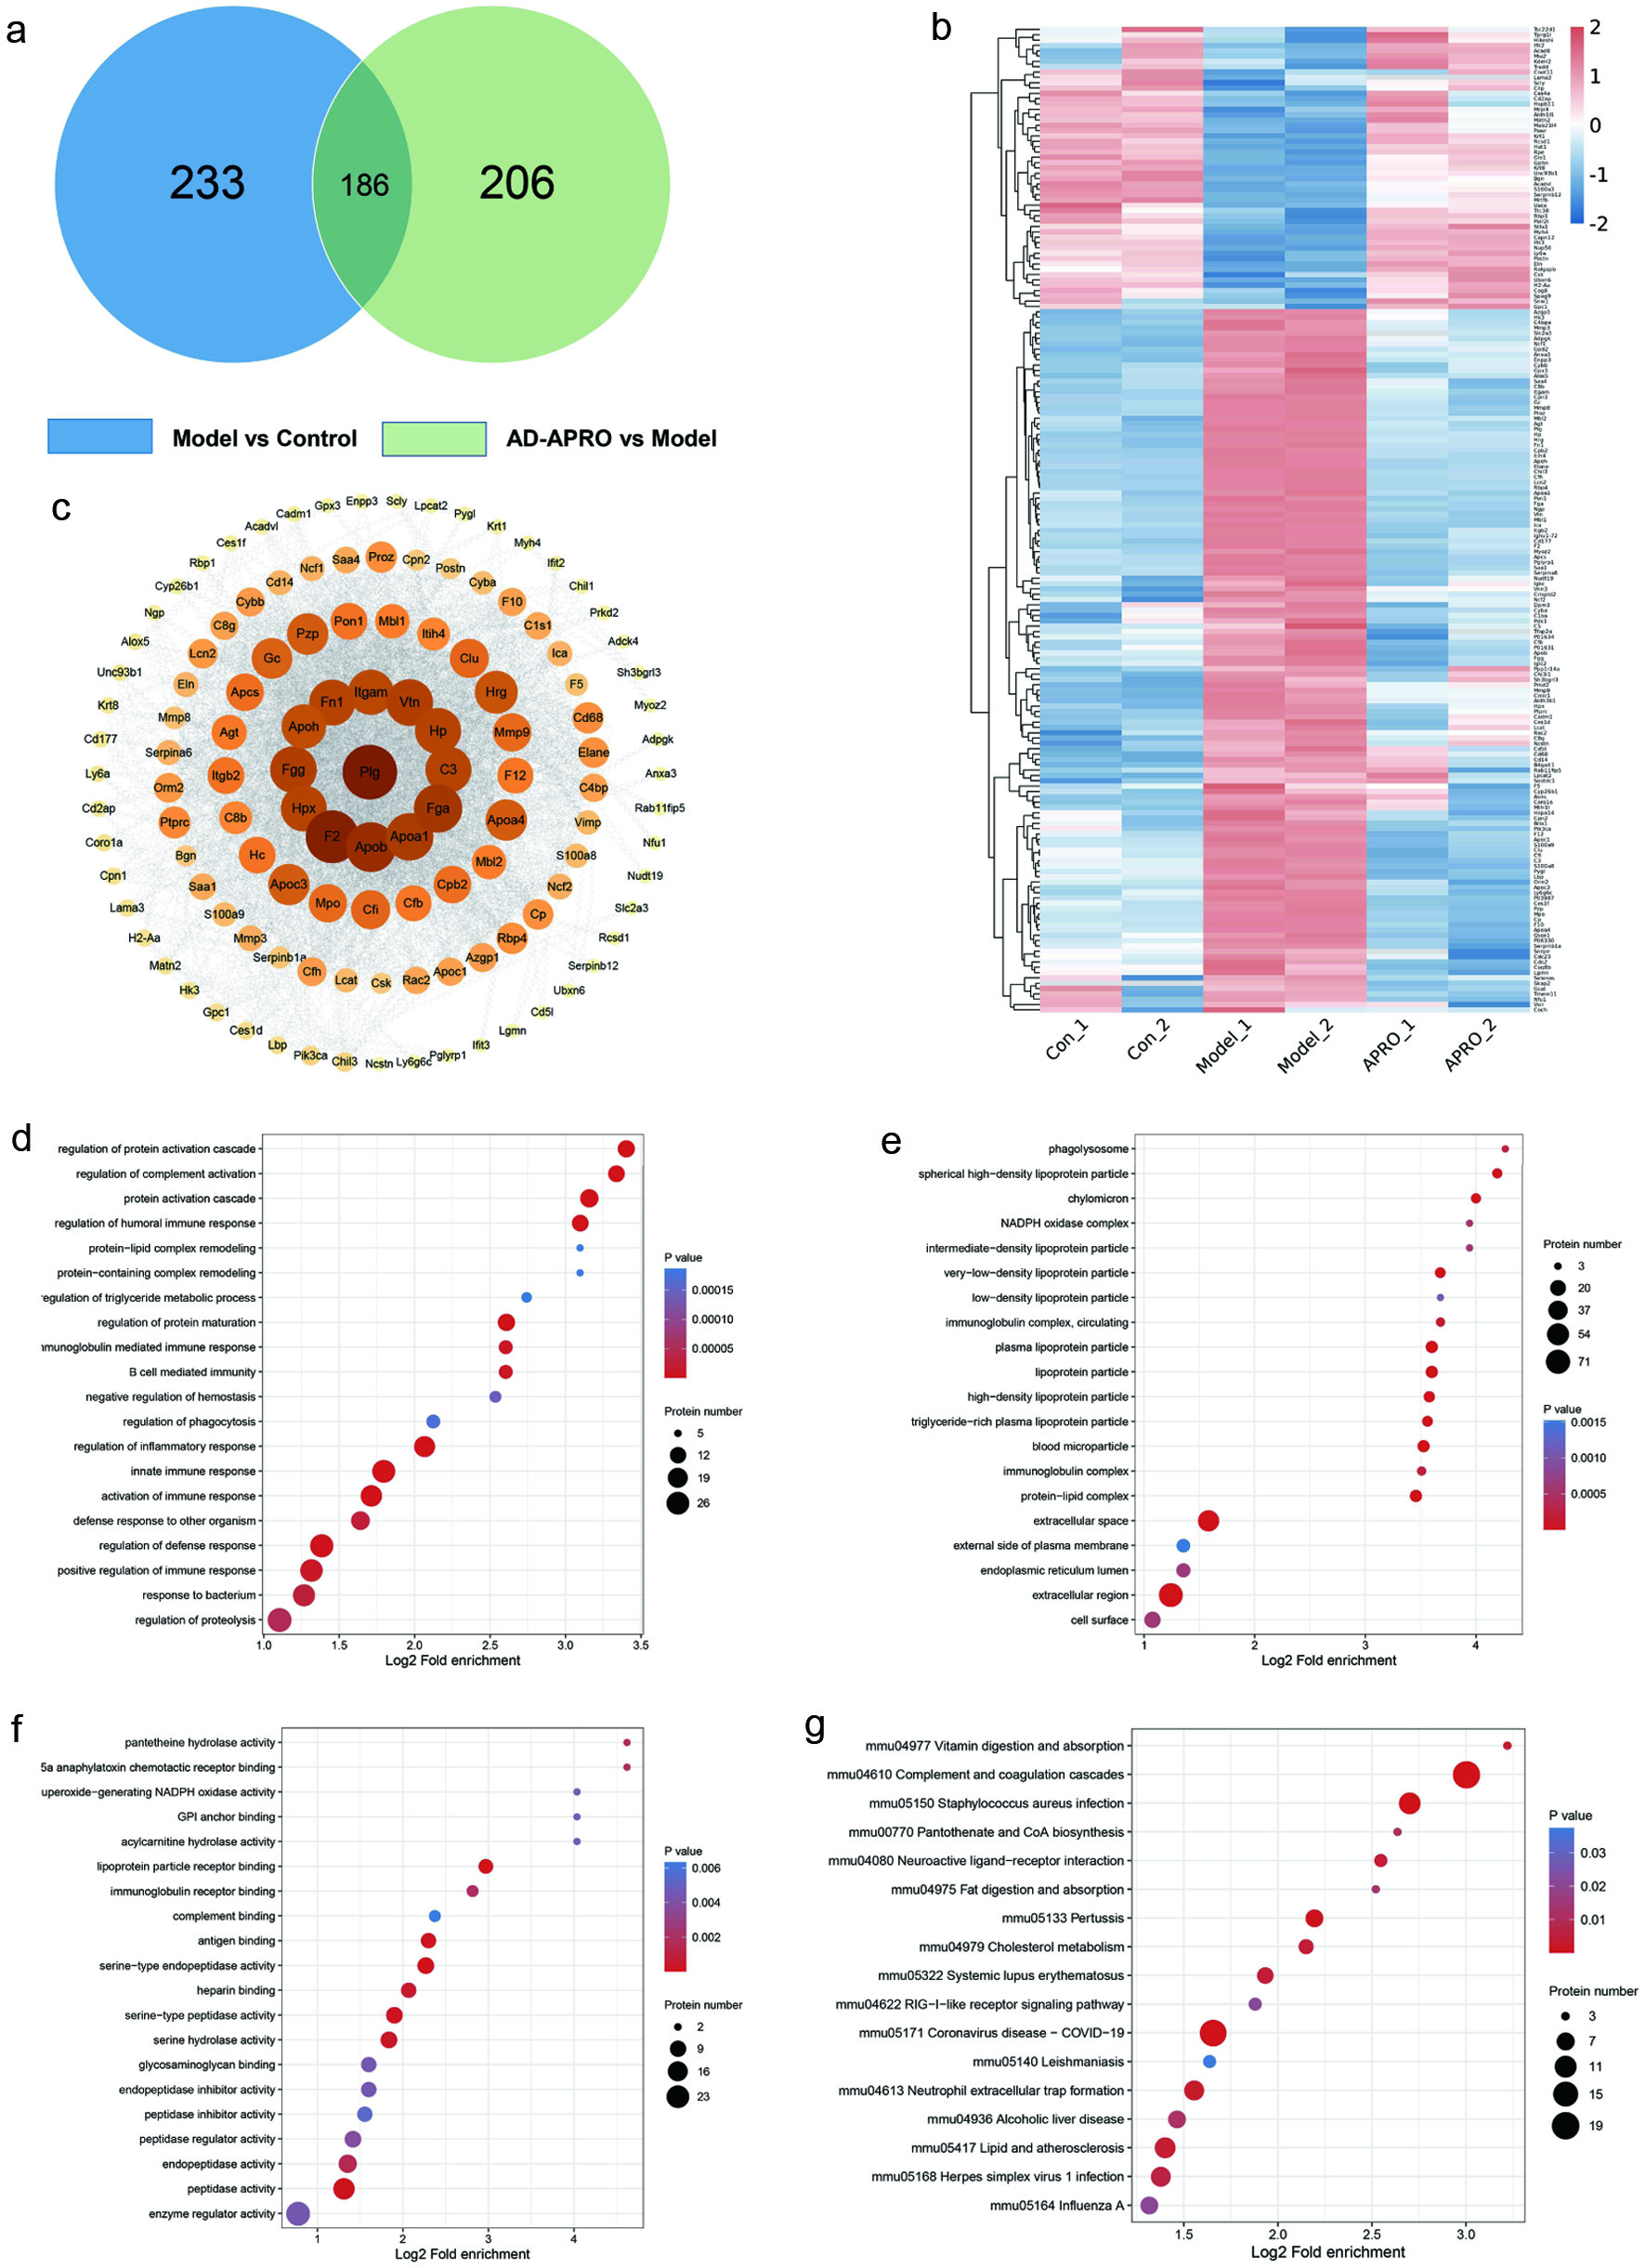
Figure 5. Peptide prediction of anti-photoaging activity in AD-APRO. (a) VENN diagram. (b) Heatmap. (c) Interaction map of the differently expressed proteins. (d–f) GO functional analysis and KEGG pathway enrichment analysis. (d) The top 20 BP terms. (e) The top of 20 CC terms. (f) The top 20 MF terms. (g) The KEGG enrichment analysis.
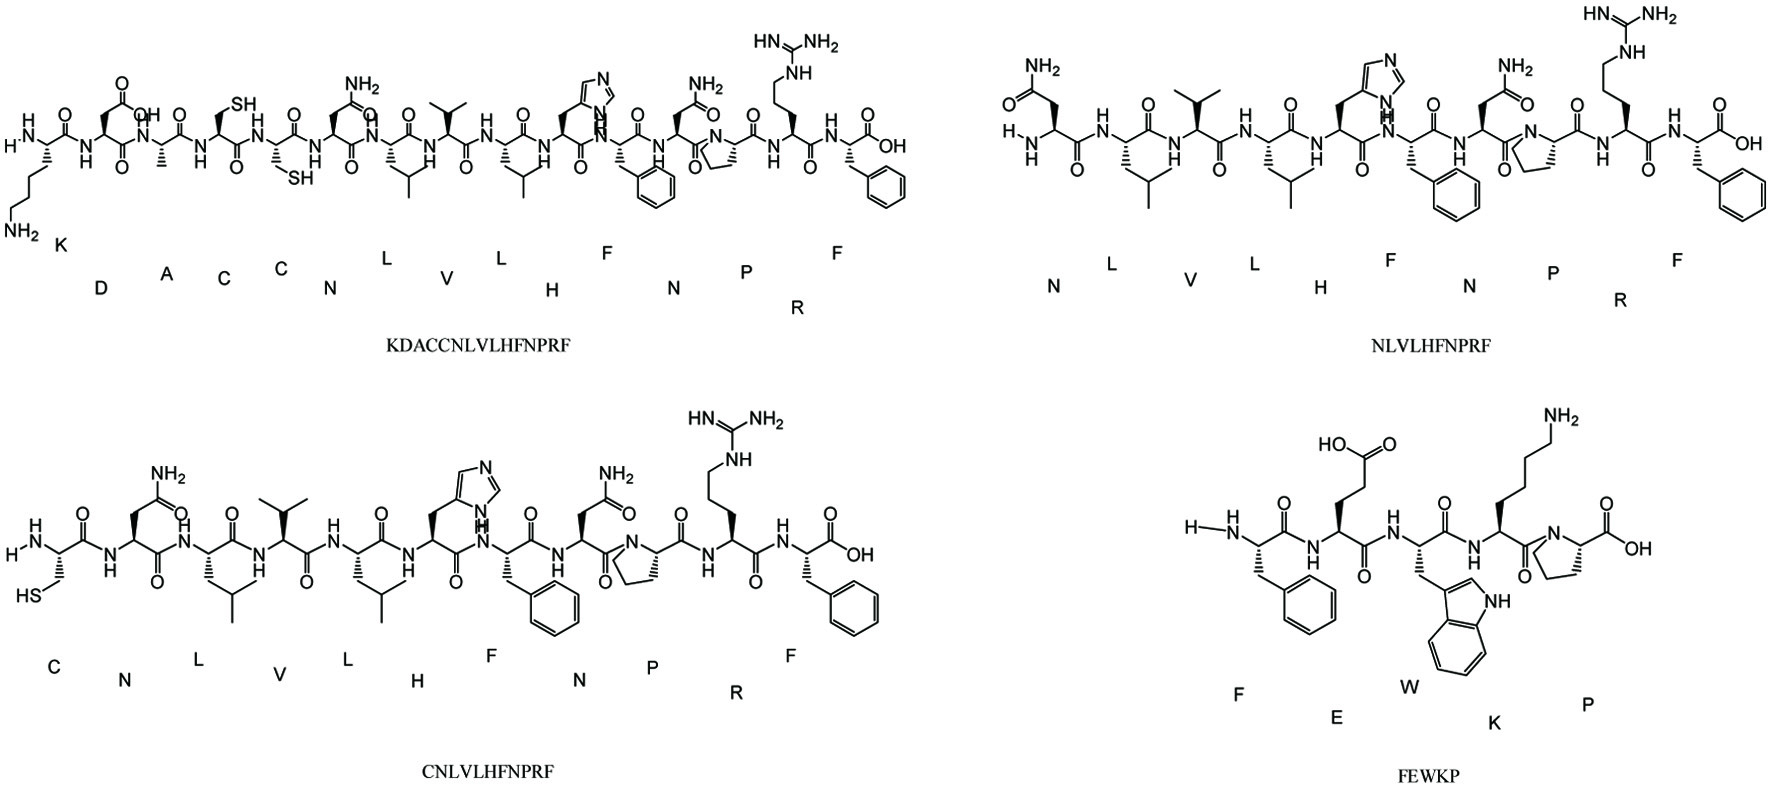
Figure 6. Structure of active peptides in AD-APRO.
Table
Table 1. Dose of administration in mice model induced by UVA combined with D-gal
| Group | UVA radiation dose (J/cm2/d) | 1% D-gal injection dose (mL/d) | Dose of drug application (mL/d) |
|---|
| Control | 0 | 0 | 0 |
| Model | 10 | 0.2 | 0 |
| VC | 10 | 0.2 | 0.2 |
| L (150 mg/mL AD-APRO) | 10 | 0.2 | 0.2 |
| H (450 mg/mL AD-APRO) | 10 | 0.2 | 0.2 |


