Figures

Figure 1. Effect of ALPs on blood lipid in diabetes mice. (a) the content of TC in serum; (b) the content of TG in serum; (c) the content of LDL-C in serum; (d) the content of HDL-C in serum. Values are the mean±SD, n=10. In a, b, and c significant differences (P<0.05) were determined by ANOVA.

Figure 2. Effect of ALPs on glucose indexes in diabetes mice. (a) Fasting blood glucose; (b) urine glucose; (c) glucose tolerance. Values are the mean±SD, n=10. In a, b, and c significant differences (P<0.05) were determined by ANOVA.

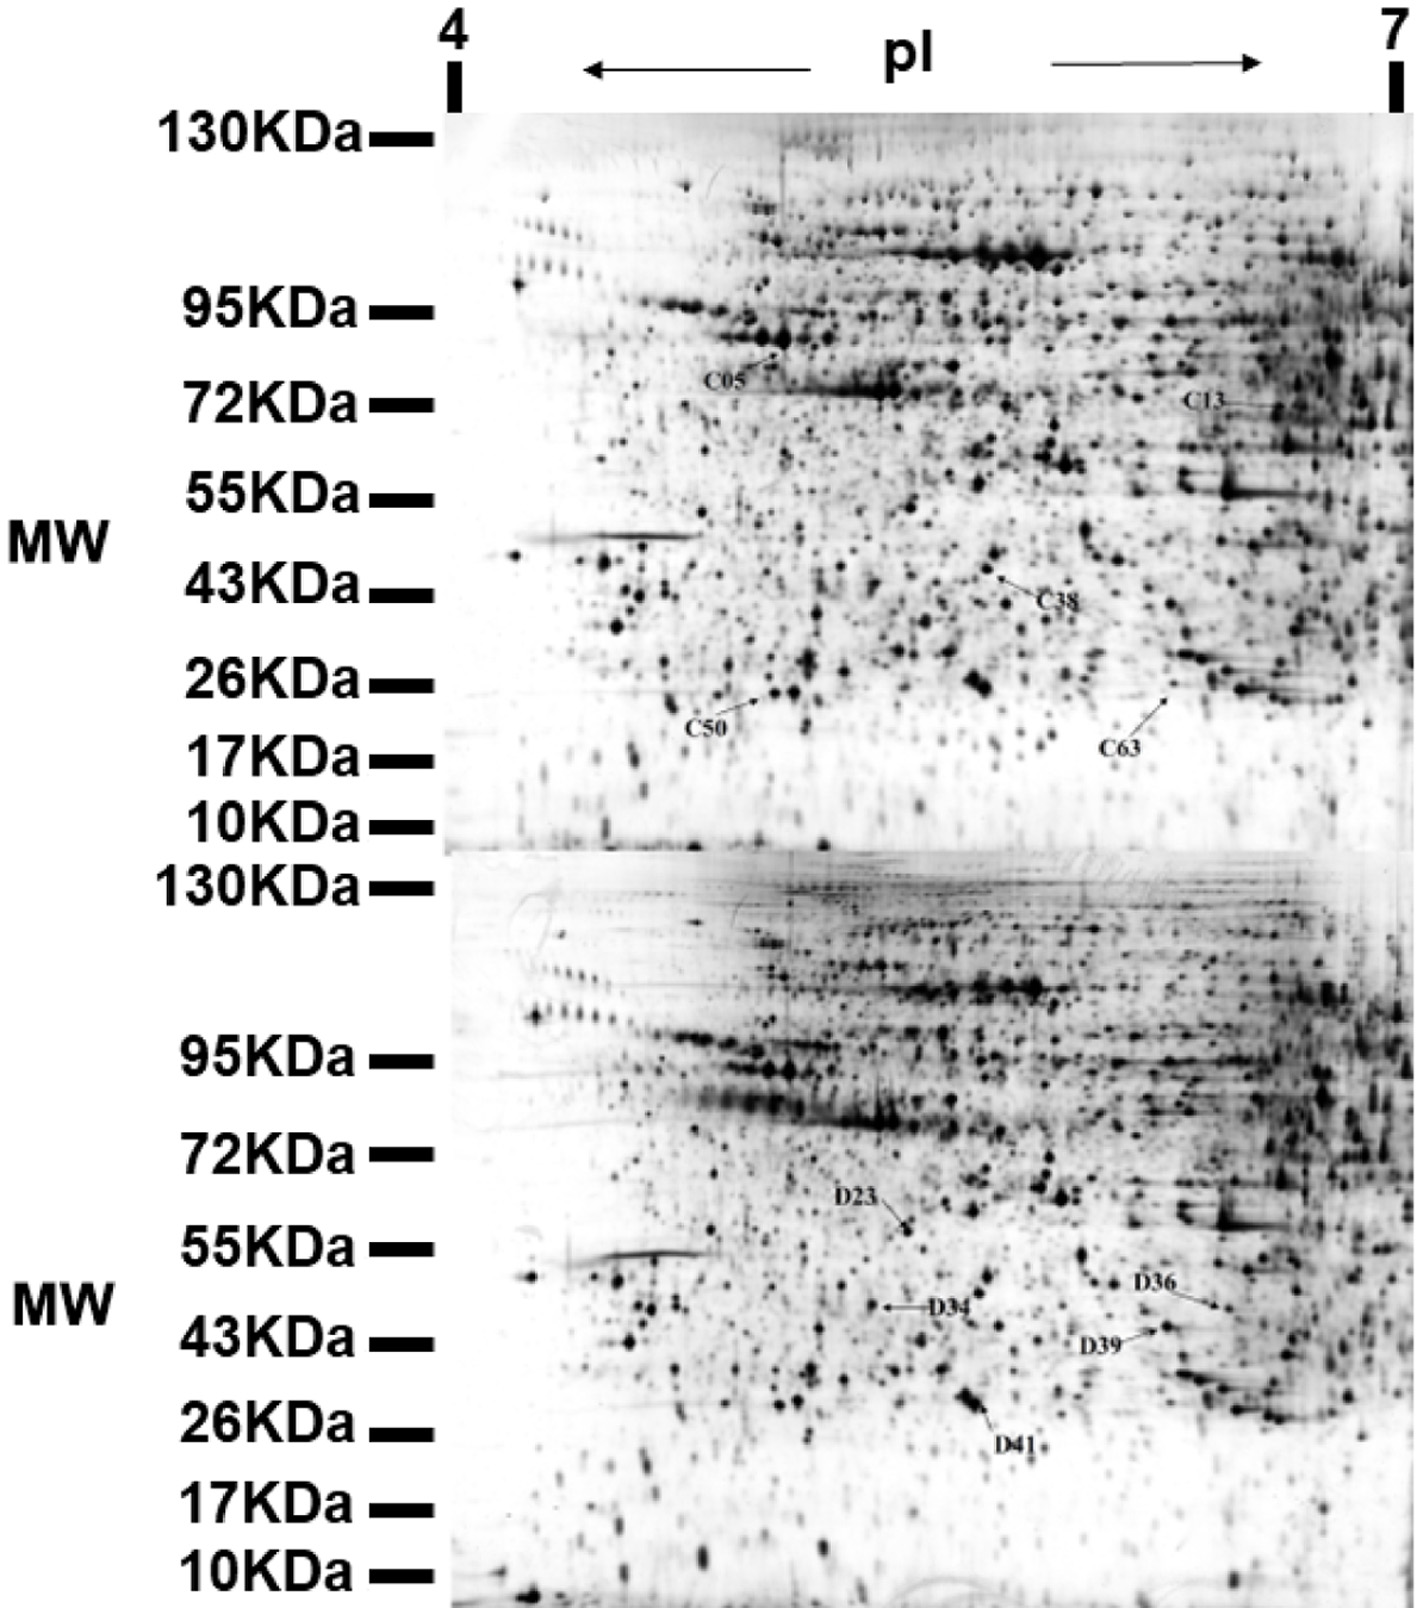
Figure 3. Representative 2-DE map obtained from diabetic mouse kidney after ALPs treatment. C denotes the up-regulated proteins in the ALPs group when compared with the model group; D denotes the down-regulated proteins in the ALPs group when compared with the model group.

Figure 4. The GO cluster analysis of different expression proteins in ALPs vs. model group. The numbers in parentheses indicate the number of genes. GO:0005739 mitochondrion, GO:0005829 cytosol, GO:0005737 cytoplasm, GO:0005615 extracellular space, GO:0005813 centrosome, GO:0016324 apical plasma membrane, GO:0005634 nucleus, GO:0043234 protein complex, GO:0005524 ATP binding, GO:0016301 kinase activity, GO:0005525 GTP binding, GO:0005509 calcium ion binding, GO:0005200 structural constituent of the cytoskeleton, GO:0046982 protein heterodimerization activity, GO:0015031 protein transport, GO:0051592 response to calcium ion, GO:0007409 axonogenesis, GO:0030336 negative regulation of cell migration, GO:0006508 proteolysis, GO:0051592 response to calcium ion, GO:0008584 male gonad development, GO:0006886 intracellular protein transport.

Figure 5. The KEGG pathway analysis of the different expression proteins. map01100 Metabolic pathways; map04931 Insulin resistance; map04145 Phagosome; map04390 Hippo signaling pathway; map05132 Salmonella infection; map05416 Viral myocarditis; map05414 Dilated cardiomyopathy; map05410 Hypertrophic cardiomyopathy (HCM); map04810 Regulation of actin cytoskeleton; map05412 Arrhythmogenic right ventricular cardiomyopathy (ARVC); map05100 Bacterial invasion of epithelial cells; map04910 Insulin signaling pathway; map04612 Antigen processing and presentation; map04151 PI3K-Akt signaling pathway; map04020 Calcium signaling pathway; map05164 Influenza A-Mus musculus; map04520 Adherens junction; map04670 Leukocyte transendothelial migration.

Figure 6. Effects of alpha-2-HS-glycoprotein on insulin signal pathway. (a)The pathogenesis of type II diabetes. when the expression of alpha-2-HS glycoprotein increases, it will inhibit insulin receptor auto-phosphorylation, insulin and insulin receptor is no longer binding, but also inhibit the downstream tyrosine kinase activity, then glycogen synthesis and glucose transport are inhibited, resulting in insulin resistance. (b) The expression of alpha-2-HS-glycoprotein in diabetic mice after feeding the ALPs is down-regulated, the insulin and insulin receptors are normally bound, the autophosphorylation of the receptor activates the intrinsic tyrosine kinase activity, further leading to the downstream signal Cascade cascade reaction occurs, the insulin signaling pathway returned to normal, resulting in insulin-mediated glucose and lipid metabolism.
Table
Table 1. Differentially expressed proteins in different groups as identified by MALDI-TOF-MS/MS. C indicates proteins up-regulated in the ALPs group, and D indicates proteins down-regulated in the ALPs group
| Spot No. | Accession No. | protein name | Mascot score | MW/pI | Ratio | |
|---|
| C13 | gi|8850219 | haptoglobin | 381 | 39,241/5.88 | 4.90527 | (↑) |
| D34 | gi|28076935 | dynactin subunit 2 isoform 3 | 80 | 44,204/5.14 | 3.80156 | (↓) |
| D41 | gi|63087695 | RAB14 protein | 147 | 24,123/5.63 | 2.5645 | (↓) |
| C63 | gi|21312044 | eukaryotic translation initiation factor 3 subunit K | 151 | 25,356/4.81 | 2.38265 | (↑) |
| D39 | gi|6679791 | aldose reductase-related protein 2 | 243 | 36,440/5.97 | 2.33046 | (↓) |
| D36 | gi|7304875 | alpha-2-HS-glycoprotein | 356 | 38,100/6.04 | 4.2232 | (↓) |
| C50 | gi|37572245 | Homogentisate 1, 2-dioxygenase | 304 | 50,699/6.86 | 2.13829 | (↑) |
| D23 | gi|31980648 | ATP synthase subunit beta, mitochondrial precursor | 309 | 56,265/5.19 | 2.01205 | (↓) |
| C38 | gi|126518317 | complement C3 precursor | 190 | 187,905/6.29 | 2.00926 | (↑) |
| C05 | gi|40556608 | heat shock protein HSP 90-beta | 285 | 83,571/4.97 | 1.62636 | (↑) |


