Figures
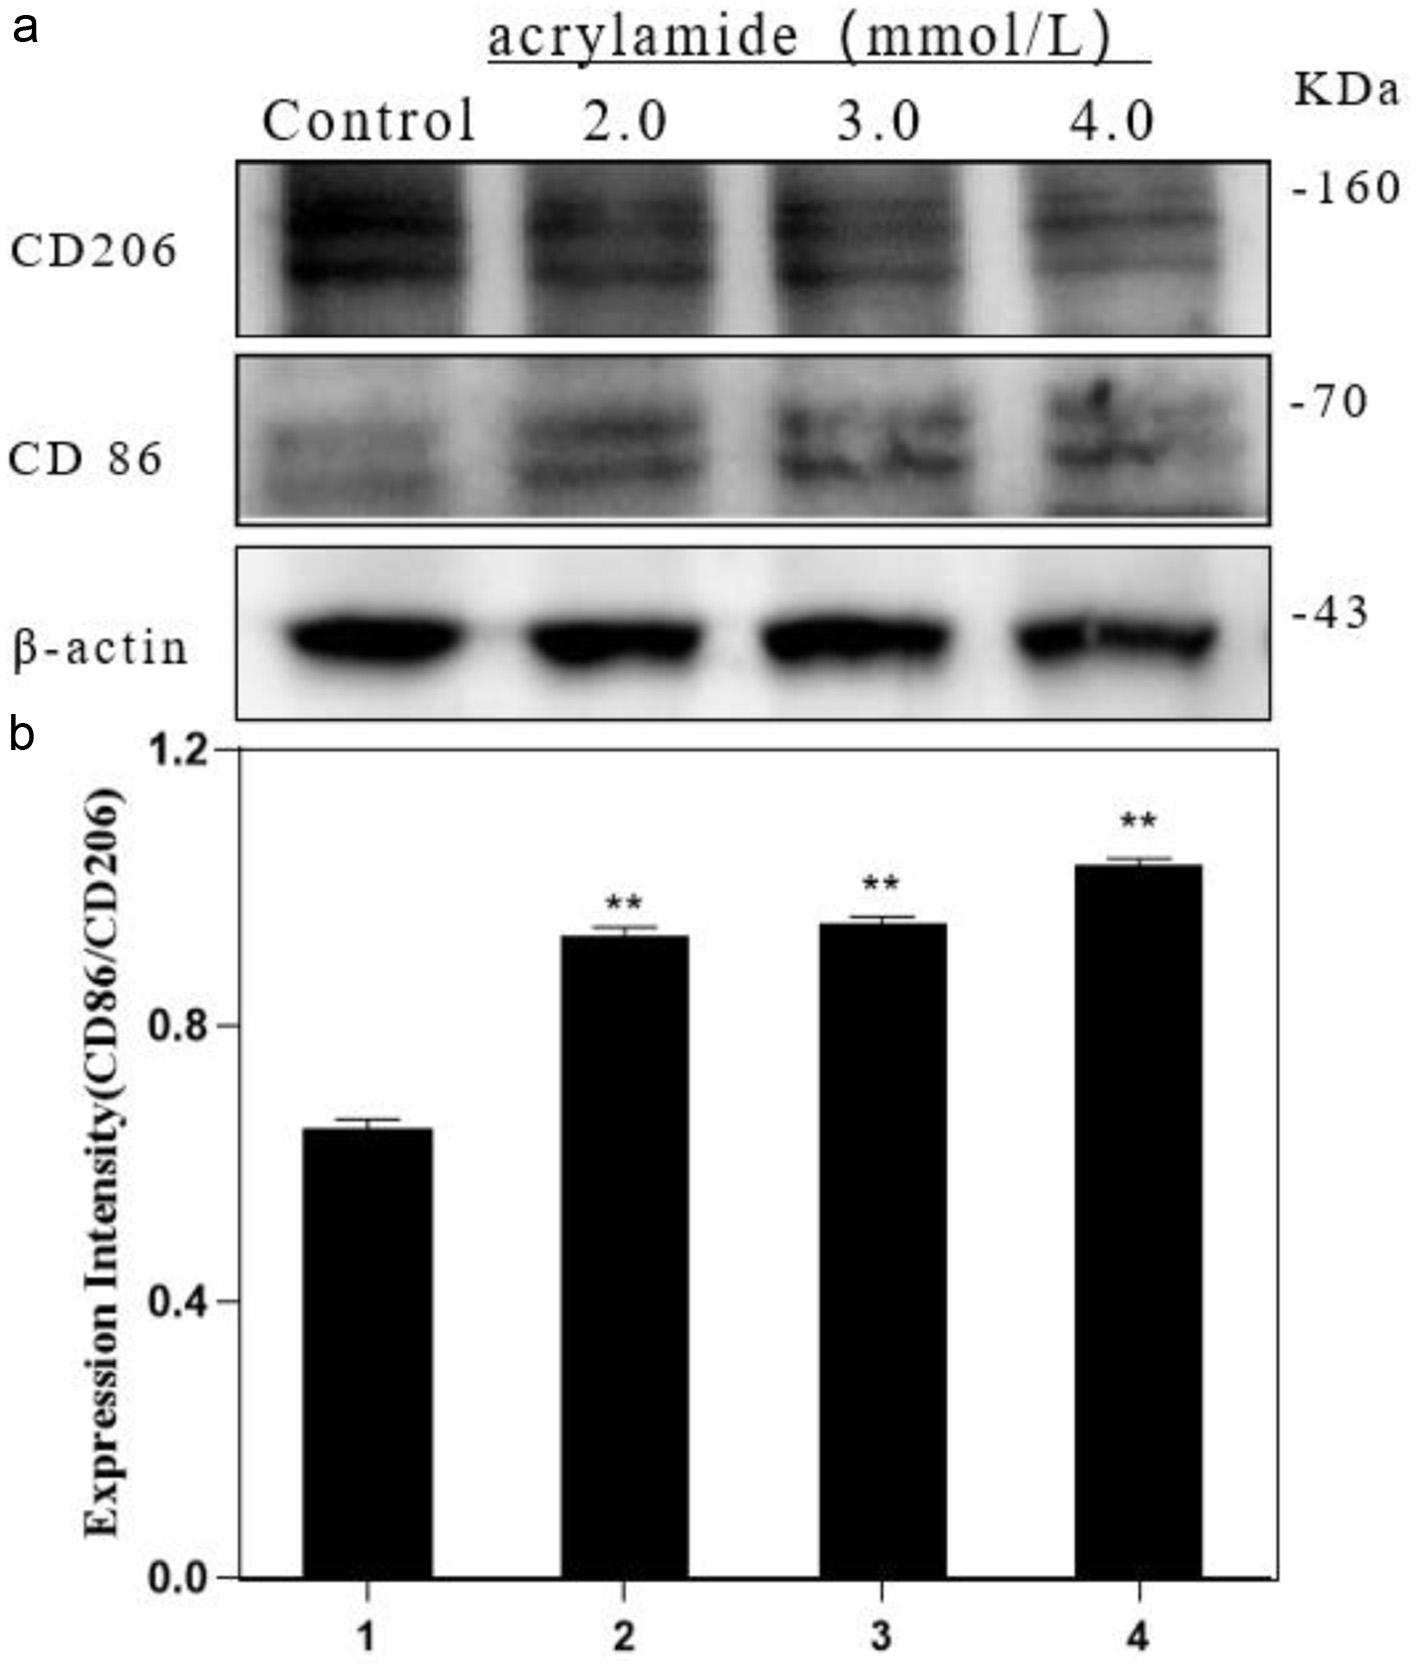
Figure 1. Effect of acrylamide on polarization of RAW264.7 cells. (a) Cells were treated with different concentrations of acrylamide for 24 h. Protein expressions were analyzed by western blot. (b) Bar chart of protein level. Lane1: Control, Lane2: 2.0 mmol/L AA, Lane3: 3.0 mmol/L AA, Lane4: 4.0 mmol/L AA. **p < 0.01, group with AA vs. group without AA.

Figure 2. Effects of acrylamide on COX-2 protein in RAW264.7 cells. (a) Cells were treated with different concentrations of acrylamide for 24 h. Protein expressions were analyzed by western blot. (b) Bar chart of protein level. Lane1: Control, Lane2: 2.0 mmol/L AA, Lane3: 3.0 mmol/L AA, Lane4: 4.0 mmol/L AA. *p < 0.05, group with AA vs. group without AA, **p < 0.01, group with AA vs. group without AA.

Figure 3. Effect of P2X7 receptor inhibitors on acrylamide-induced polarization of RAW264.7 cells. (a) Cells were treated with acrylamide and P2X7 inhibitor (A 438079) for 24 h. Protein expressions were analyzed by western blot. (b) Bar chart of protein level. Lane1: Control, Lane2: 3.0 mmol/L AA, Lane3: 3.0 mmol/L AA + 10.0 μmol/L A 438079, Lane4: 10.0 μmol/L A 438079. **p < 0.01 vs. Lane1, ##p < 0.01 vs. Lane2.
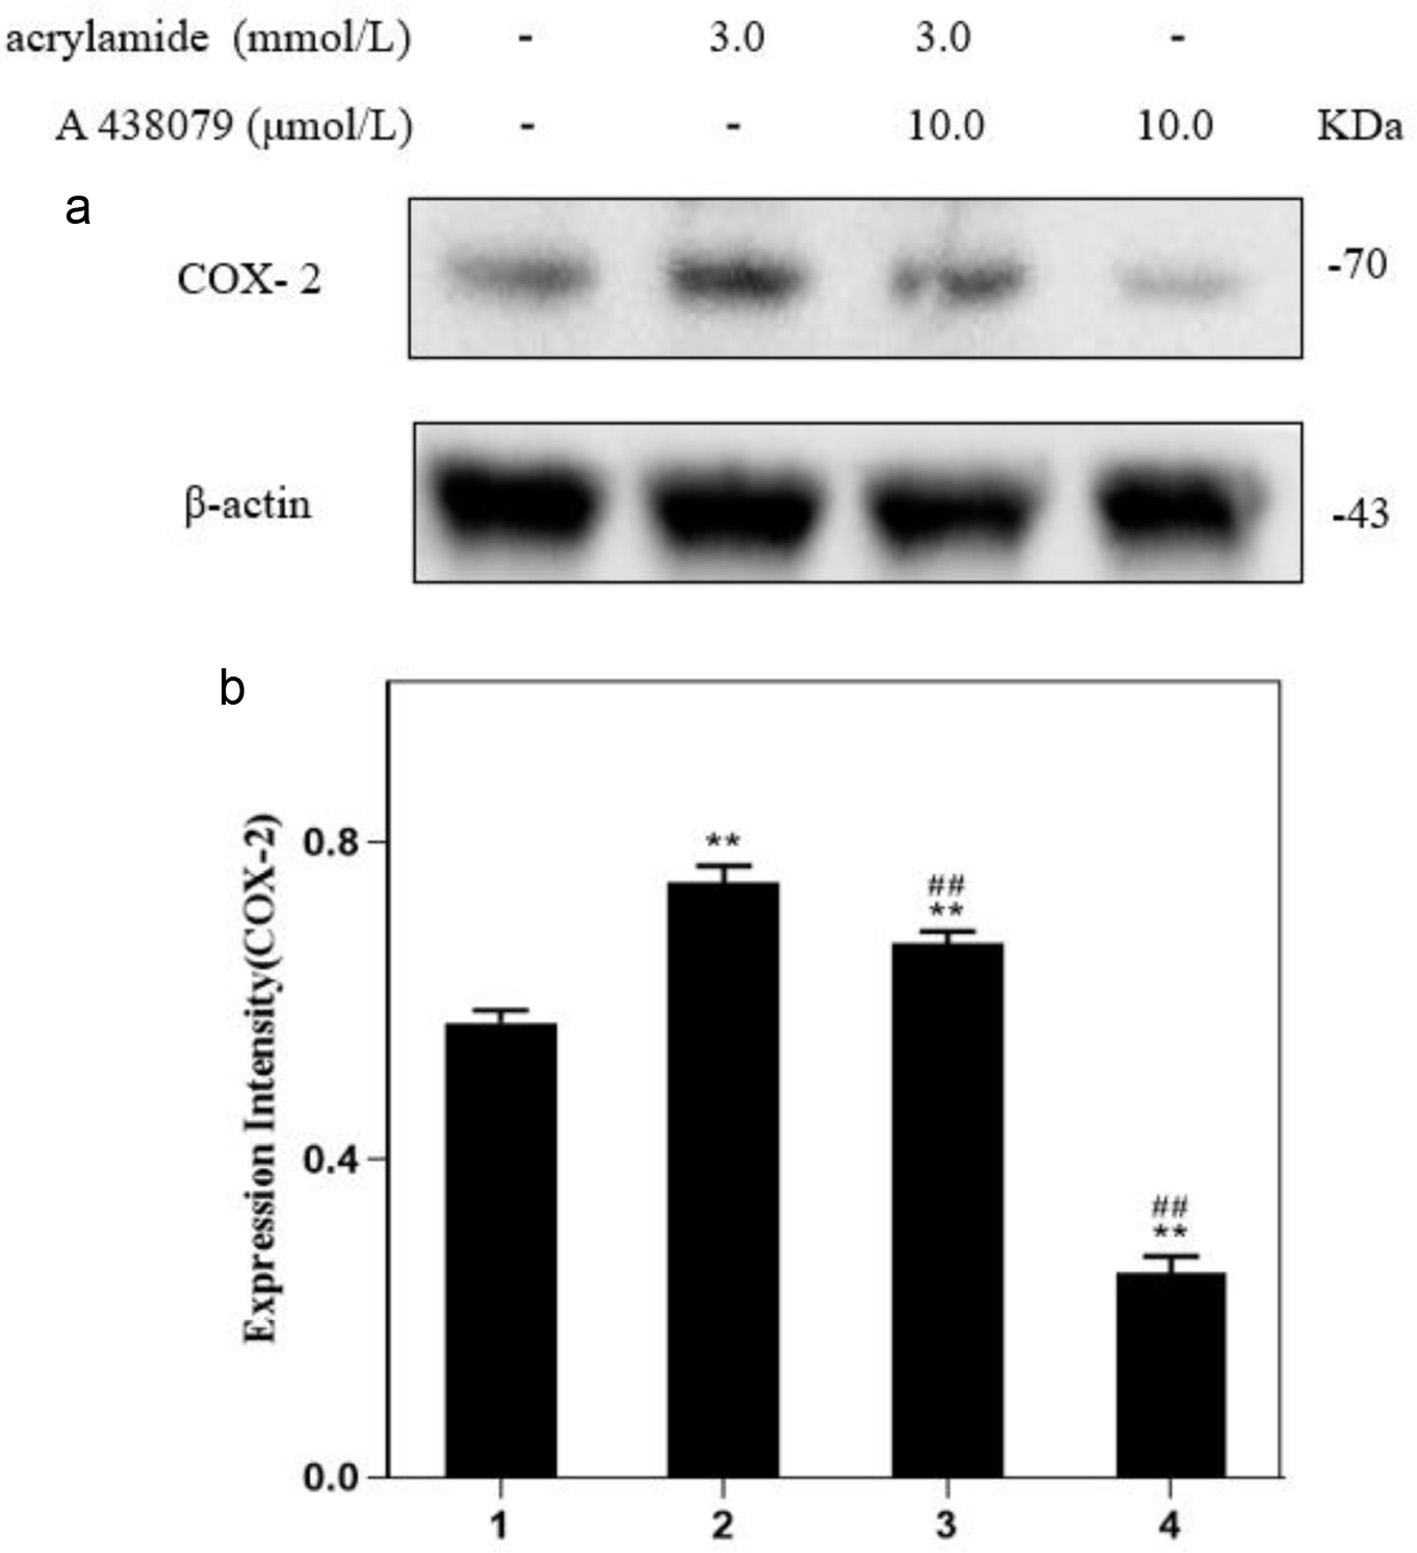
Figure 4. Effect of P2X7 receptor inhibitors on acrylamide-induced COX-2 protein in RAW264.7 cells. (a) Cells were treated with acrylamide and P2X7 inhibitor (A 438079) for 24 h. Protein expressions were analyzed by western blot. (b) Bar chart of protein level. Lane1: Control, Lane2: 3.0 mmol/L AA, Lane3: 3.0 mmol/L AA + 10.0 μmol/L A 438079, Lane4: 10.0 μmol/L A 438079. **p < 0.01 vs. Lane1, ##p < 0.01 vs. Lane2.

Figure 5. Effects of YPS on acrylamide-induced polarization of RAW264.7 cells. (a) Cells were treated with YPS and acrylamide for 24 h. Protein expressions were analyzed by western blot. (b) Bar chart of protein level. Lane1: Control, Lane2: 50.0 μg/mL YPS, Lane3: 4.0 mmol/L AA + 50.0 μg/mL YPS, Lane4: 4.0 mmol/L AA. **p < 0.01 vs. Lane1, ##p < 0.01 vs. Lane4.

Figure 6. Effects of YPS on acrylamide-induced COX-2 protein in RAW264.7 cells. (a) Cells were treated with YPS and acrylamide for 24 h. Protein expressions were analyzed by western blot. (b) Bar chart of protein level. Lane1: Control, Lane2: 50.0 μg/mL YPS, Lane3: 4.0 mmol/L AA + 50.0 μg/mL YPS, Lane4: 4.0 mmol/L AA. **p < 0.01 vs. Lane1, ##p < 0.01 vs. Lane4.

Figure 7. The cell viability of HepG2 cell cultured in RAW264.7 cell medium treated with YPS. Lane1: Control, Lane2: 50.0 μg/mL YPS, Lane3: 100.0 μg/mL YPS, Lane4: 150.0 μg/mL YPS. Lane5: 200.0 μg/mL YPS. Lane6: 400.0 μg/mL YPS. **p < 0.01 vs. Lane1.

Figure 8. The cell viability of HepG2 cell cultured in RAW264.7 cell medium treated with YPS and AA. Lane1: Control, Lane2: 1.0mmol/LAA, Lane3: 1.0 mmol/L AA + 50.0 μg/mL YPS, Lane4: 1.0 mmol/L AA + 100.0 μg/mL YPS. Lane5: 1.0 mmol/L AA + 150.0 μg/mL YPS. Lane6: 1.0 mmol/L AA + 200.0 μg/mL YPS. **p < 0.01 vs. Lane1, ##p < 0.01 vs. Lane2.