Figures

Figure 1. Schematic diagram of the animal experiment. C57BL/6J female mice were randomly assigned to the groups. Normal diet was 10% fat (as a percentage of total kcal) and high-fat diet was 60% fat (as a percentage of total kcal). PPE was supplemented to mice by oral gavage. NC: negative control group 1, HFD/LPS: positive control group, LPP: low-dose PPE treated group, HPP: high-dose PPE treated group. Each group had 12 mice (n = 12).

Figure 2. Effects of purple potato extract (PPE) on body weight gain, plasma glucose and insulin levels and lipid profile. a), percent average body weight gain (n = 12); b), AUC of glucose tolerance test; c), plasma insulin concentration; d), plasma lipid profile, triglyceride; e), cholesterol; f), HDL cholesterol and g), LDL cholesterol. The negative control (NC) group represents the mice that have a normal diet, while the HF/LPS and HF represent the mice administered with HFD with or without LPS. The mice pre-treated with PPE at low and high doses are designated LPP and HPP, respectively. Results are represented as means ± SEM, n = 6. Values without a common letter are significantly different at p < 0.05.

Figure 3. Effects of purple potato extract (PPE) on plasma concentrations of endotoxin and pro-inflammatory cytokines. a), endotoxin; b), MCP-1; c), TNF-α; d), IL-6. The negative control (NC) group represents the mice that have a normal diet, while the HF/LPS and HF represent the mice administered with HFD with or without LPS. The mice pre-treated with PPE at low and high doses are designated LPP and HPP, respectively. Results are represented as means ± SEM, n = 6. Values without a common letter are significantly different at p < 0.05.

Figure 4. Effects of purple potato extract (PPE) on macrophage infiltration, adiponectin and protein expression in white adipose tissues (WAT). a), immuno-histochemical images of WAT. Scale bar represents 20 µm; b), percentage of adipocytes with macrophage infiltration (crown-like structure) in WAT; c), adiponectin in WAT; d), PPAR-γ and E) IRS-1 protein expression in WAT. β-actin was used as reference protein. The negative control (NC) group represents the mice that have a normal diet, while the HF/LPS and HF represent the mice administered with HFD with or without LPS. The mice pre-treated with PPE at low and high doses are designated LPP and HPP, respectively. Results are represented as mean ± SEM, n = 12 for panels A-C; n = 6 for panels D and E. Values without a common letter are significantly different at p < 0.05.

Figure 5. Modulatory effect of purple potato extract (PPE) on intestinal integrity related markers. a), on plasma D-mannitol level; b), on tight junction proteins in tissues of jejunum; c), on tight junction proteins and pro- and anti-inflammatory cytokines and in tissues of colon. The negative control (NC) group represents the mice that have a normal diet, while the HF/LPS and HF represent the mice administered with HFD with or without LPS. The mice pre-treated with PPE at low and high doses are designated LPP and HPP, respectively. Results are represented as mean ± SEM, n = 6. Values without a common letter are significantly different at p < 0.05.

Figure 6. Supplementation of purple potato extract (PPE) regulates intestinal metabolism. a), on fecal microbial-derived SCFAs and BCFAs; b), a heat-map of fecal metabolites; and c), metabolic pathway networks regulated by HPP treatment. Fresh fecal samples were collected from mice in the following treatment groups. The negative control (NC) group represents the mice that have a normal diet, while the HF/LPS and HF represent the mice administered with HFD with or without LPS. The mice pre-treated with PPE at low and high doses are designated LPP and HPP, respectively. Results are represented as mean ± SEM, n = 6. Values without a common letter are significantly different at p < 0.05.
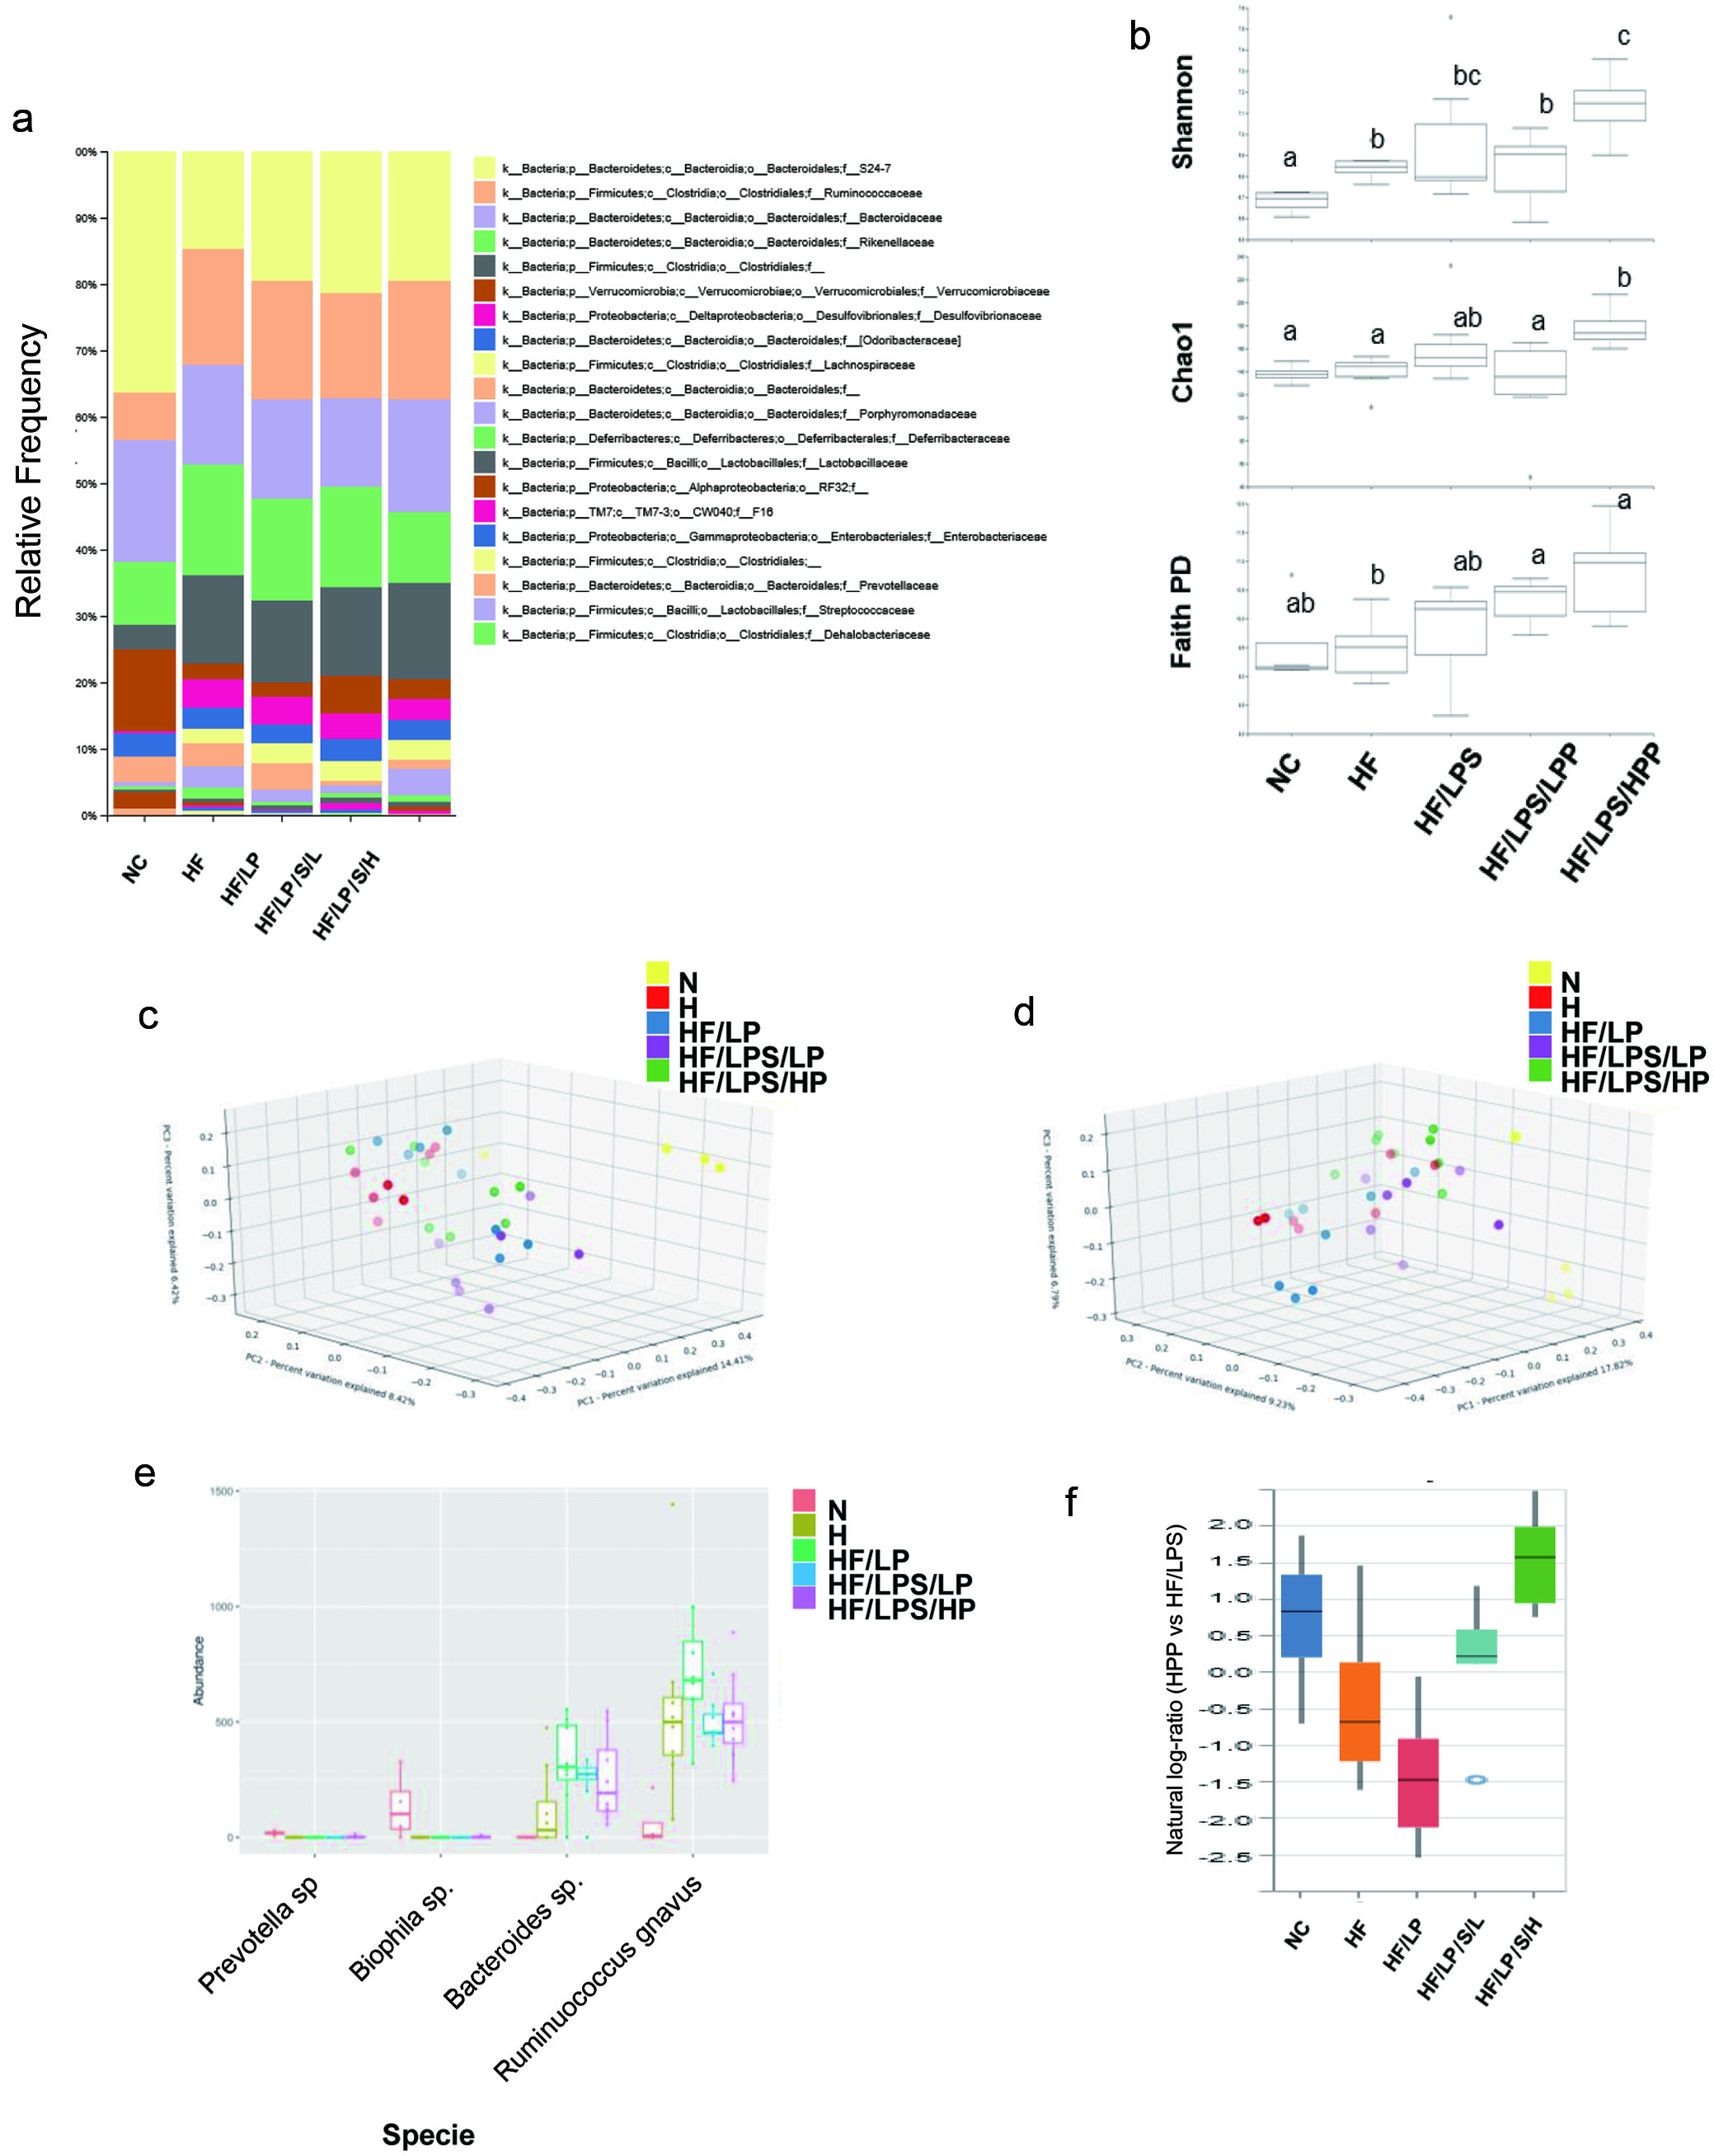
Figure 7. The impact of purple potato extract (PPE) on beta-diversity and community structure of fecal microbiota. a), relative abundances of microbial taxonomic groups at the family level; b) alpha-diversity of microbial communities from each treatment group based on Shannon, Chao1 and Faith Phylogenetic Diversity metrics. Statistically significant differences between groups (Kruskal-Wallis, q < 0.05) are indicated by different letters; c) and d), samples were clustered by principal coordinate analysis (PCoA) of Jaccard (c) or Unweighted UniFrac (d) distance matrices. The first three principal coordinates (PC1, PC2, PC3) are plotted for each mouse; e), absolute abundances of bacterial species identified as differentially abundant between treatment groups by ANCOM analysis; f), Differential abundance results of ASVs associated with the HPP group, using the HF/LPS group as reference, identified by Songbird analysis and visualized with Qurro. The top 10% of positively- and negatively-associated ASVs were used as numerator and denominator, respectively, for plotting natural log ratios. The associated ASV are given in Table S2.