Journal of Food Bioactives, ISSN 2637-8752 print, 2637-8779 online
Journal website www.isnff-jfb.com

Original Research

Volume 17, March 2022, pages 27-33


Transport mechanism of eurycomanone from Eurycoma longifolia Jack across Caco-2 cells model

Figures

Figure 1.
Figure 1. The survival rate of Caco-2 cells after incubation for 24 h at different concentrations of eurycomanone (μg/mL). The results showed that addition of eurycomanone had no significant impact on cell viabilities compared with the control group.
Figure 2.
Figure 2. Establishment of a 21-days Caco-2 cells monolayer model by real-time monitoring of change by TEER value. All experiments were performed three times.
Figure 3.
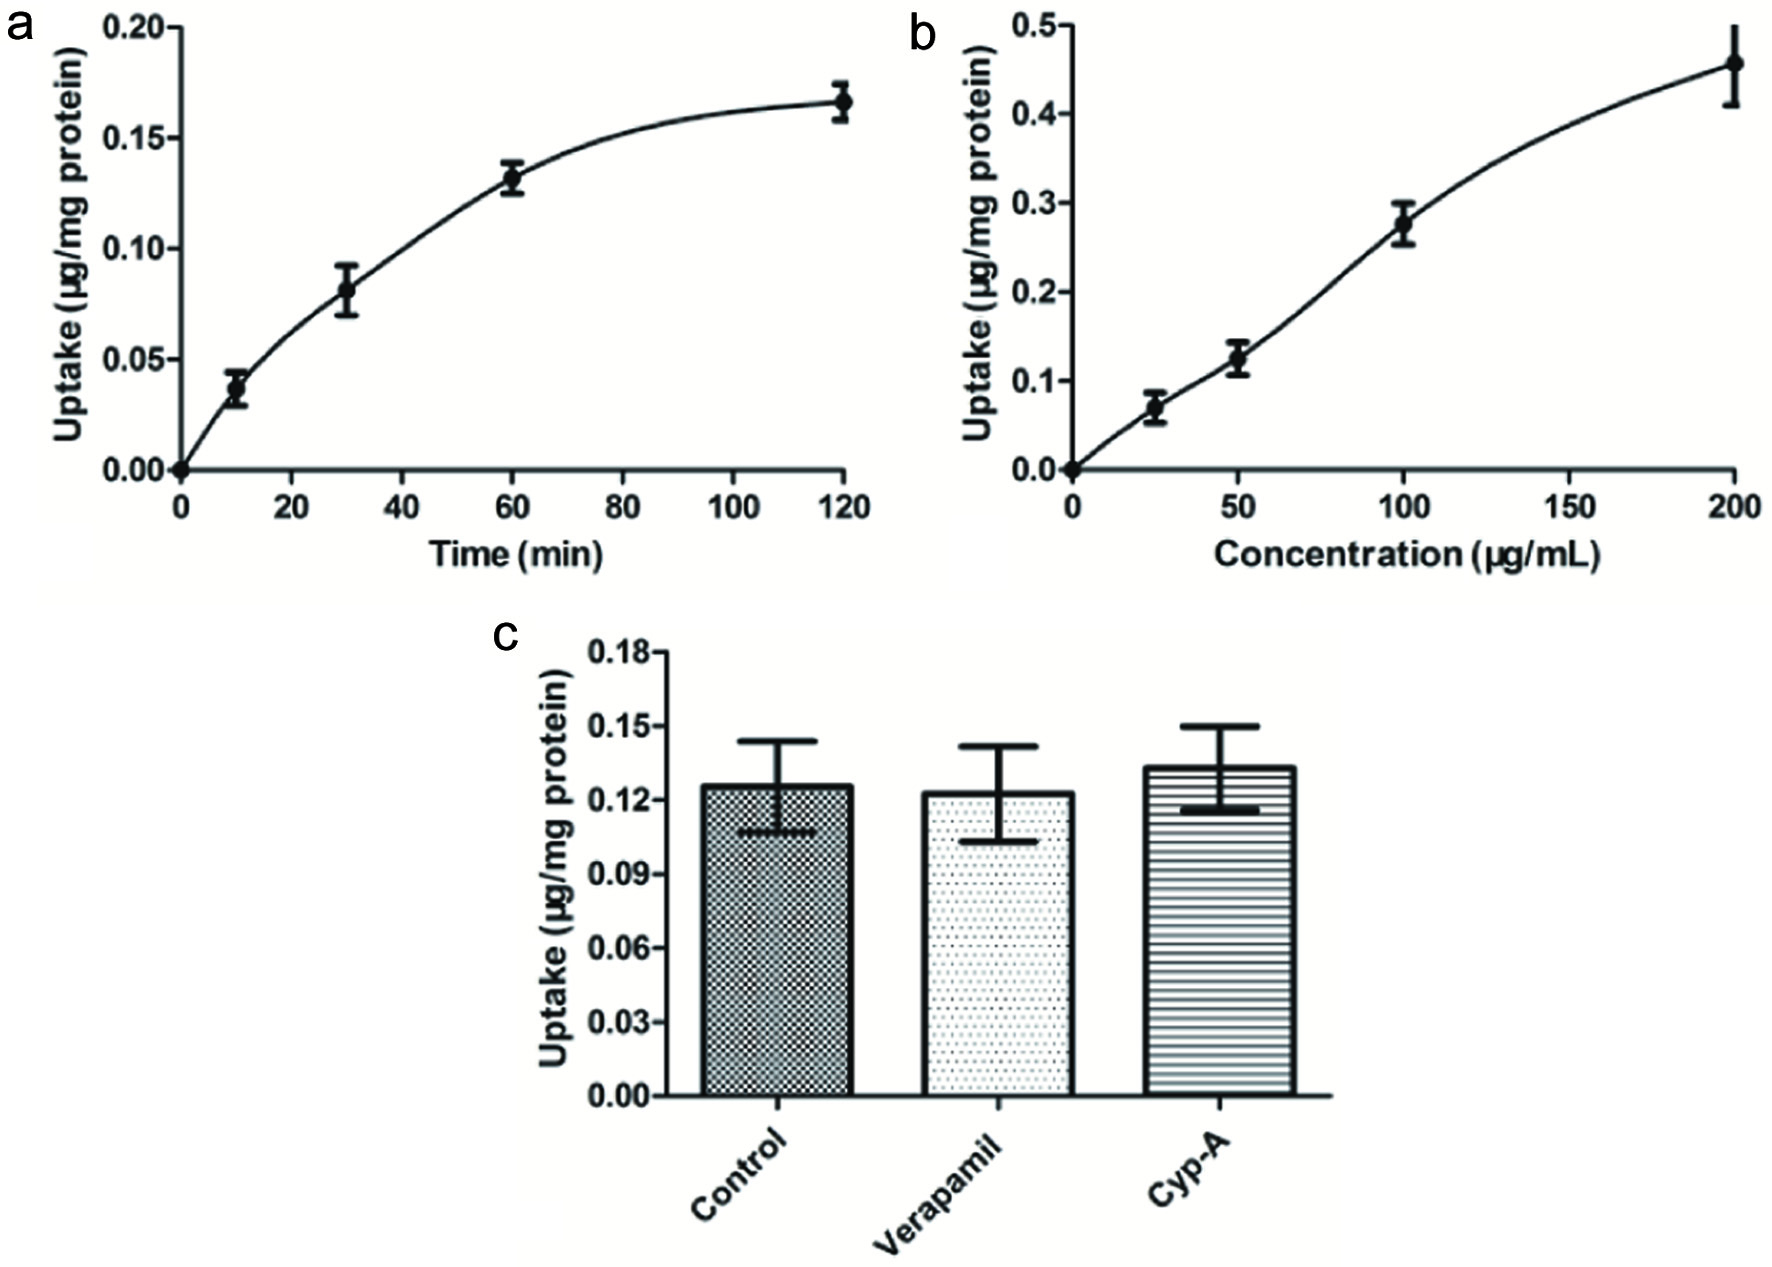
Figure 3. Effect of incubation time (a), concentration of eurycomanone (b) and P-glycoprotein inhibitor (c) on the uptake of eurycomanone in Caco-2 cell. (a) Caco-2 cells were incubated at 37 °C in HBSS containing 50 μg/mL of eurycomanone for 120 min. (b) Caco-2 cells were incubated for 60 min at 37 °C with different concentration (0, 25, 50, 100, 200 μg/mL) of eurycomanone. (c) Caco-2 cells were incubated for 60 min at 37 °C with eurycomanone (50 μg/mL) alone, eurycomanone (50 μg/mL) with Verapamil (100 μg/mL), and eurycomanone (50 μg/mL) with Cyp-A (100 μg/mL), respectively. Each point is presented as mean ± SD, n = 3.
Figure 4.
Figure 4. AP→BL (a) and BL→AP (b) are the effect of incubation time on cell transport; the effects of paracellular enhancers (c) and P-gp (d) inhibitors on transmembrane transport of eurycomanone.

Tables

Table 1. Effects of some factors on the transport of samples
 
FACTORSAPICAL SIDE (0.5 ML)BASAL SIDE (1.5 ML)TRANSPORT TIME (H)
CONCENTRATIONeurycomanone (25, 50, 100, 200 μg/mL)HBSS buffer1
HBSS buffereurycomanone (25, 50, 100, 200 μg/mL)1
TEMPERATURE4 °C , 37 °C (eurycomanone 50 μg/mL)HBSS buffer1
HBSS buffer4 °C , 37 °C (eurycomanone 50 μg/mL)1
TIMEeurycomanone (25, 50, 100, 200 μg/mL)HBSS buffer0.5 h, 1 h, 2 h, 3 h
HBSS buffereurycomanone (25, 50, 100, 200 μg/mL)0.5 h, 1 h, 2 h, 3 h
P-GP INHIBITOR100 μg/mL verapamil; 100 μg/mLcyclosporin AHBSS buffer1 h
HBSS buffer100 μg/mL verapamil; 100 μg/mL cyclosporin A1 h
ABSORPTION ENHANCER100 μg/mL sodium deoxycholate; 100 μg/mL EDTAHBSS buffer1 h
HBSS buffer100 μg/mL sodium deoxycholate; 100 μg/mL EDTA1 h


Table 2. Mannitol transmittance of Caco-2 cells at different time points (x ± s, n = 3)
 
Time (h)Transmission rate (%/h/cm2)P value
Note: compare with time (0.5 h) group.
0.50.52 ± 0.04
1.00.44 ± 0.030.2876
1.50.46 ± 0.030.2876
2.00.40 ± 0.030.2397
3.00.42 ± 0.020.0578


Table 3. Effect of concentration on bidirectional transport (x ± s, n = 3)
 
Concentration (μg/mL)Papp × 10−7 (cm/s)ERP value
AP→BLBL→AP
Note: compare with concentration25 (μg/mL) group.
254.15 ± 0.683.59 ± 0.900.87-
504.47 ± 1.073.72 ± 0.600.830.3224
1004.41 ± 0.993.61 ± 0.540.820.2045
2003.99 ± 1.383.45 ± 0.840.860.8552


Table 4. Effect of temperature on bidirectional transport (x ± s, n = 3)
 
Temperature (°C)Papp × 10−7 (cm/s)ER
AP→BLBL→AP
44.04 ± 0.433.53 ± 0.350.87
374.47 ± 1.073.72 ± 0.600.83