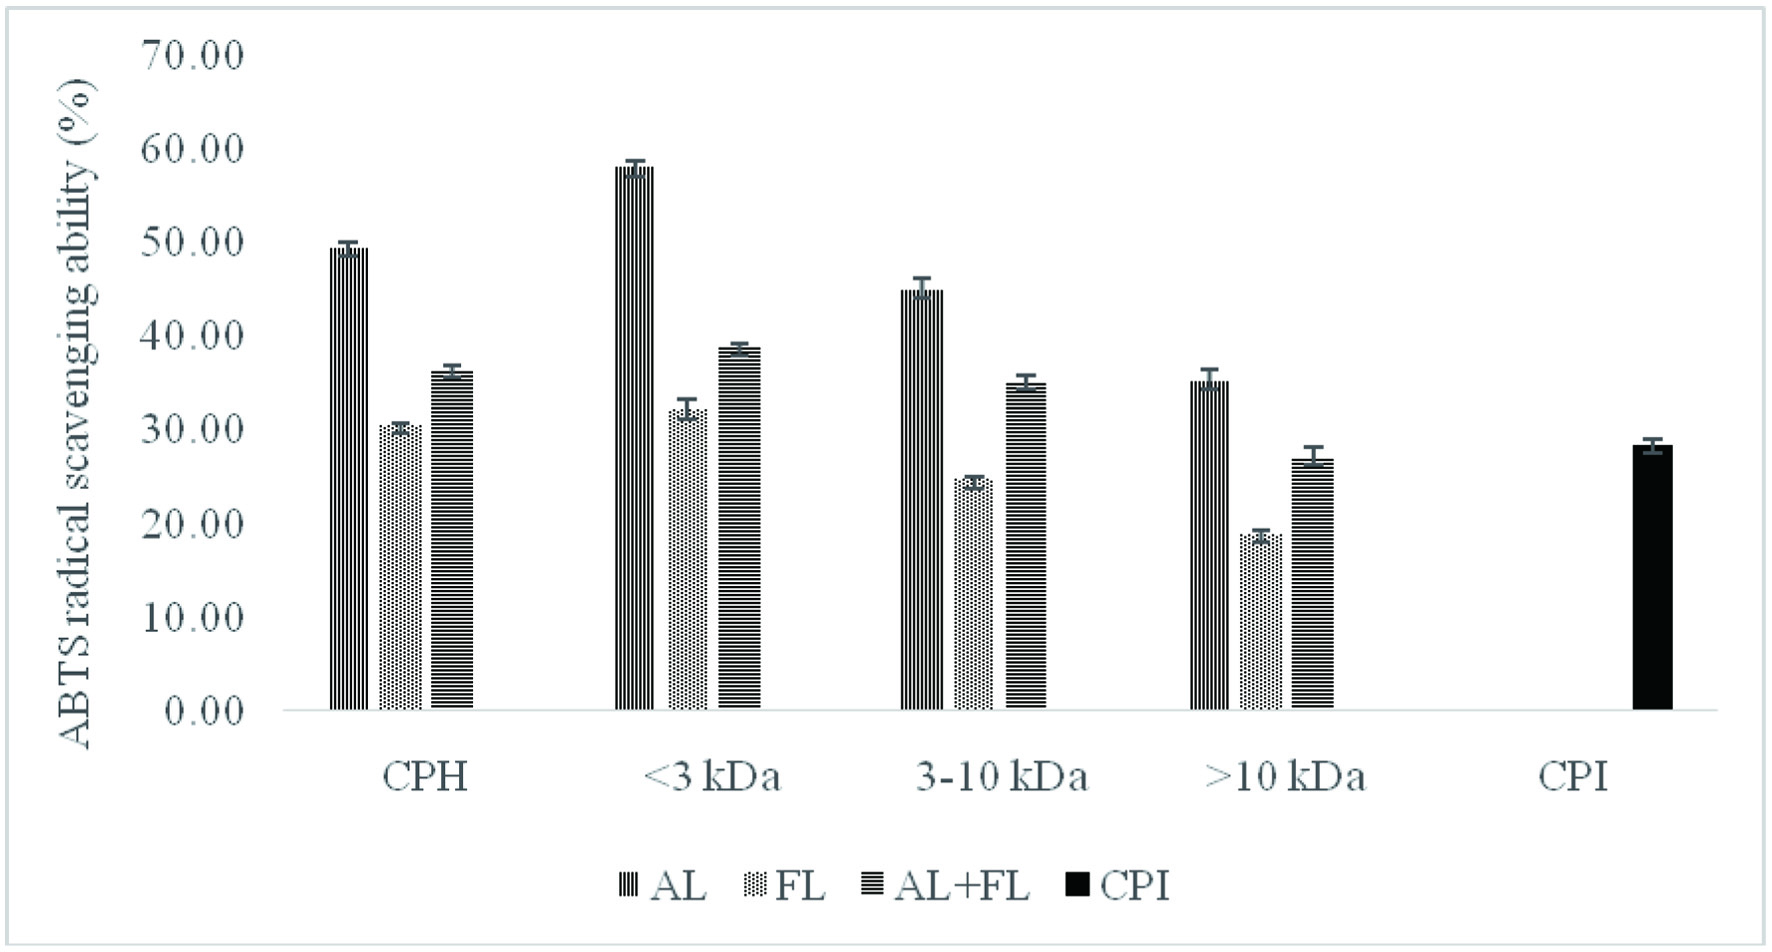
Figure 1. ABTS radical scavenging activity of camelina protein isolates (CPI), hydrolysates (CPH) and their peptide fractions prepared by using enzymatic treatment (AL, Alcalase; FL, Flavourzyme; and AL + FL, Mixture of Alcalase and Flavourzyme).
| Journal of Food Bioactives, ISSN 2637-8752 print, 2637-8779 online |
| Journal website www.isnff-jfb.com |
Original Research
Volume 16, December 2021, pages 75-82
Antioxidant properties of camelina (Camelina sativa (L.) Crantz) protein hydrolysates
Figures

Tables
| Proteases | Reducing power (µmol TE/mg of protein) | |||
|---|---|---|---|---|
| Hydrolysates | <3 kDa | 3–10 kDa | >10 kDa | |
| AL, Alcalase; FL, Flavourzyme; AL + FL, Mixture of Alcalase and Flavourzyme. Data presented as mean ± SD (n = 3). Results followed by the same lowercase letter in the column and by the same uppercase letter in the row are not significantly different at p < 0.05. | ||||
| AL | 1.39 ± 0.02 aB | 1.1 ± 0.01aC | 1.44 ± 0.01aA | 0.82 ± 0.01bD |
| FL | 0.90 ± 0.01cB | 0.64 ± 0.01cC | 1.20 ± 0.01bA | 0.92 ± 0.02aB |
| AL+FL | 1.27 ± 0.01bA | 0.77 ± 0.01bD | 1.08 ± 0.02cB | 0.82 ± 0.01bC |
| Protease | µmol of Histidine/mg protein | Hydroxyl radical scavenging activity (%) | ||||||
|---|---|---|---|---|---|---|---|---|
| Hydrolysates | <3 kDa | 3–10 kDa | >10 kDa | Hydrolysates | <3 kDa | 3–10 kDa | >10 kDa | |
| AL, Alcalase; FL, Flavourzyme; AL + FL, Mixture of Alcalase and Flavourzyme. Data presented as mean ± SD (n = 3). Results followed by the same lowercase letter in the column and by the same uppercase letter in the row are not significantly different at p < 0.05. | ||||||||
| AL | 3.21 ± 0.03 aB | 3.80 ± 0.03 aA | 2.90 ± 0.02 aC | 1.93 ± 0.09 aD | 52.11 ± 0.38 aB | 59.00 ± 0.39 aA | 48.41 ± 0.27 aC | 37.06 ± 1.04 aD |
| FL | 2.50 ± 0.06 cB | 2.92 ± 0.04 cA | 2.27 ± 0.05 cC | 1.57 ± 0.05 bD | 43.73 ± 0.72 cB | 48.65 ± 0.44 bA | 41.05 ± 0.54 cC | 32.79 ± 0.53 bD |
| AL+FL | 2.71 ± 0.06 bB | 3.25 ± 0.04 bA | 2.77 ± 0.09 bB | 2.03 ± 0.05 aC | 46.16 ± 0.75 bB | 52.56 ± 0.46 cA | 46.90 ± 1.06 bB | 38.28 ± 0.63 aC |
| Essential amino acid (EAA) | Camelina | WHO/FAO (1991) | |
|---|---|---|---|
| Protein isolates | Protein hydrolysates | ||
| Histidine (His) | 2.43 | 2.12 | 1.6 |
| Isoleucine (Ile) | 3.54 | 2.88 | 1.3 |
| Leucine (Leu) | 6.19 | 4.94 | 1.9 |
| Lysine (Lys) | 3.34 | 2.31 | 1.6 |
| Methionine (Met) | 1.78 | 1.54 | 1.7 |
| Phenylalanine (Phe) | 4.19 | 3.27 | |
| Threonine (Thr) | 3.45 | 2.81 | 0.9 |
| Tryptophan (Trp) | 0.91 | 1.37 | 0.5 |
| Valine (Val) | 4.64 | 3.86 | 1.3 |
| Non EAA (NEEA) | |||
| Alanine (Ala) | 3.18 | 2.78 | |
| Arginine (Arg) | 8.61 | 7.04 | |
| Aspartic acid + Asparagine (Asp + Asn) | 7.20 | 6.38 | |
| Cystine (Cys) | 1.38 | 1.38 | |
| Glutamic acid + Glutamine (Glu + Gln) | 15.43 | 12.69 | |
| Glycine (Gly) | 4.12 | 3.22 | |
| Proline (Pro) | 4.22 | 3.45 | |
| Serine (Ser) | 3.81 | 3.08 | |
| Tyrosine (Tyr) | 2.97 | 2.42 | |
| Phenylalanine + Tyrosine (Phe + Tyr) | 7.16 | 3.27 | 1.9 |