Journal of Food Bioactives, ISSN 2637-8752 print, 2637-8779 online
Journal website www.isnff-jfb.com

Original Research

Volume 14, June 2021, pages 114-125


Functional fermented carob milk: probiotic viability and polyphenolic profile

Figures

Figure 1.
Figure 1. Changes in total phenolic content (TPC) of carob fermented milk (FCP12) during refrigerated storage (a) and in vitro digestion (b). Small letters indicate significant differences (p < 0.05) during storage period and different steps of digestion of the fermented milk. AF: After fermentation (16 h), BD: Before digestion.
Figure 2.
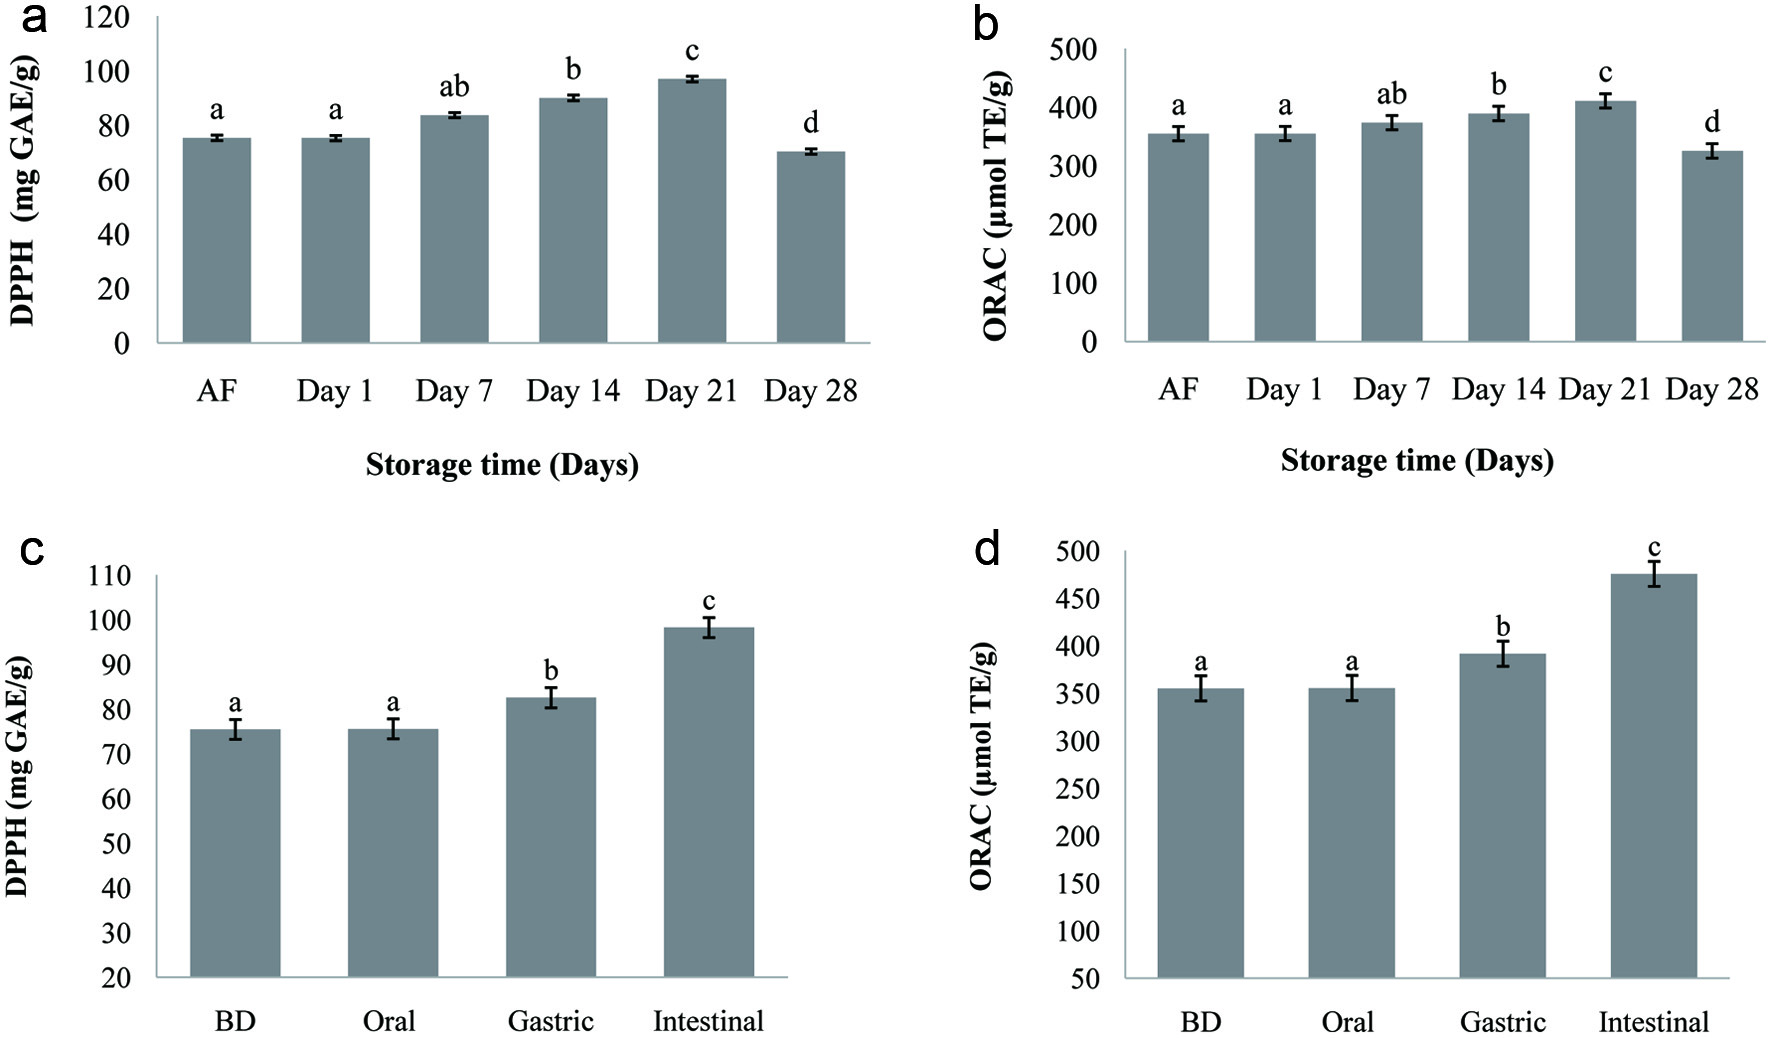
Figure 2. Antioxidant activity (DPPH and ORAC) of carob fermented milk during the refrigerated storage (4 °C) (a, b) and during the in vitro digestion (c, d). Small letters indicate significant differences (p < 0.05) during storage period and different steps of digestion of the fermented milk. AF: after fermentation (16 h), BD: before digestion.
Figure 3.
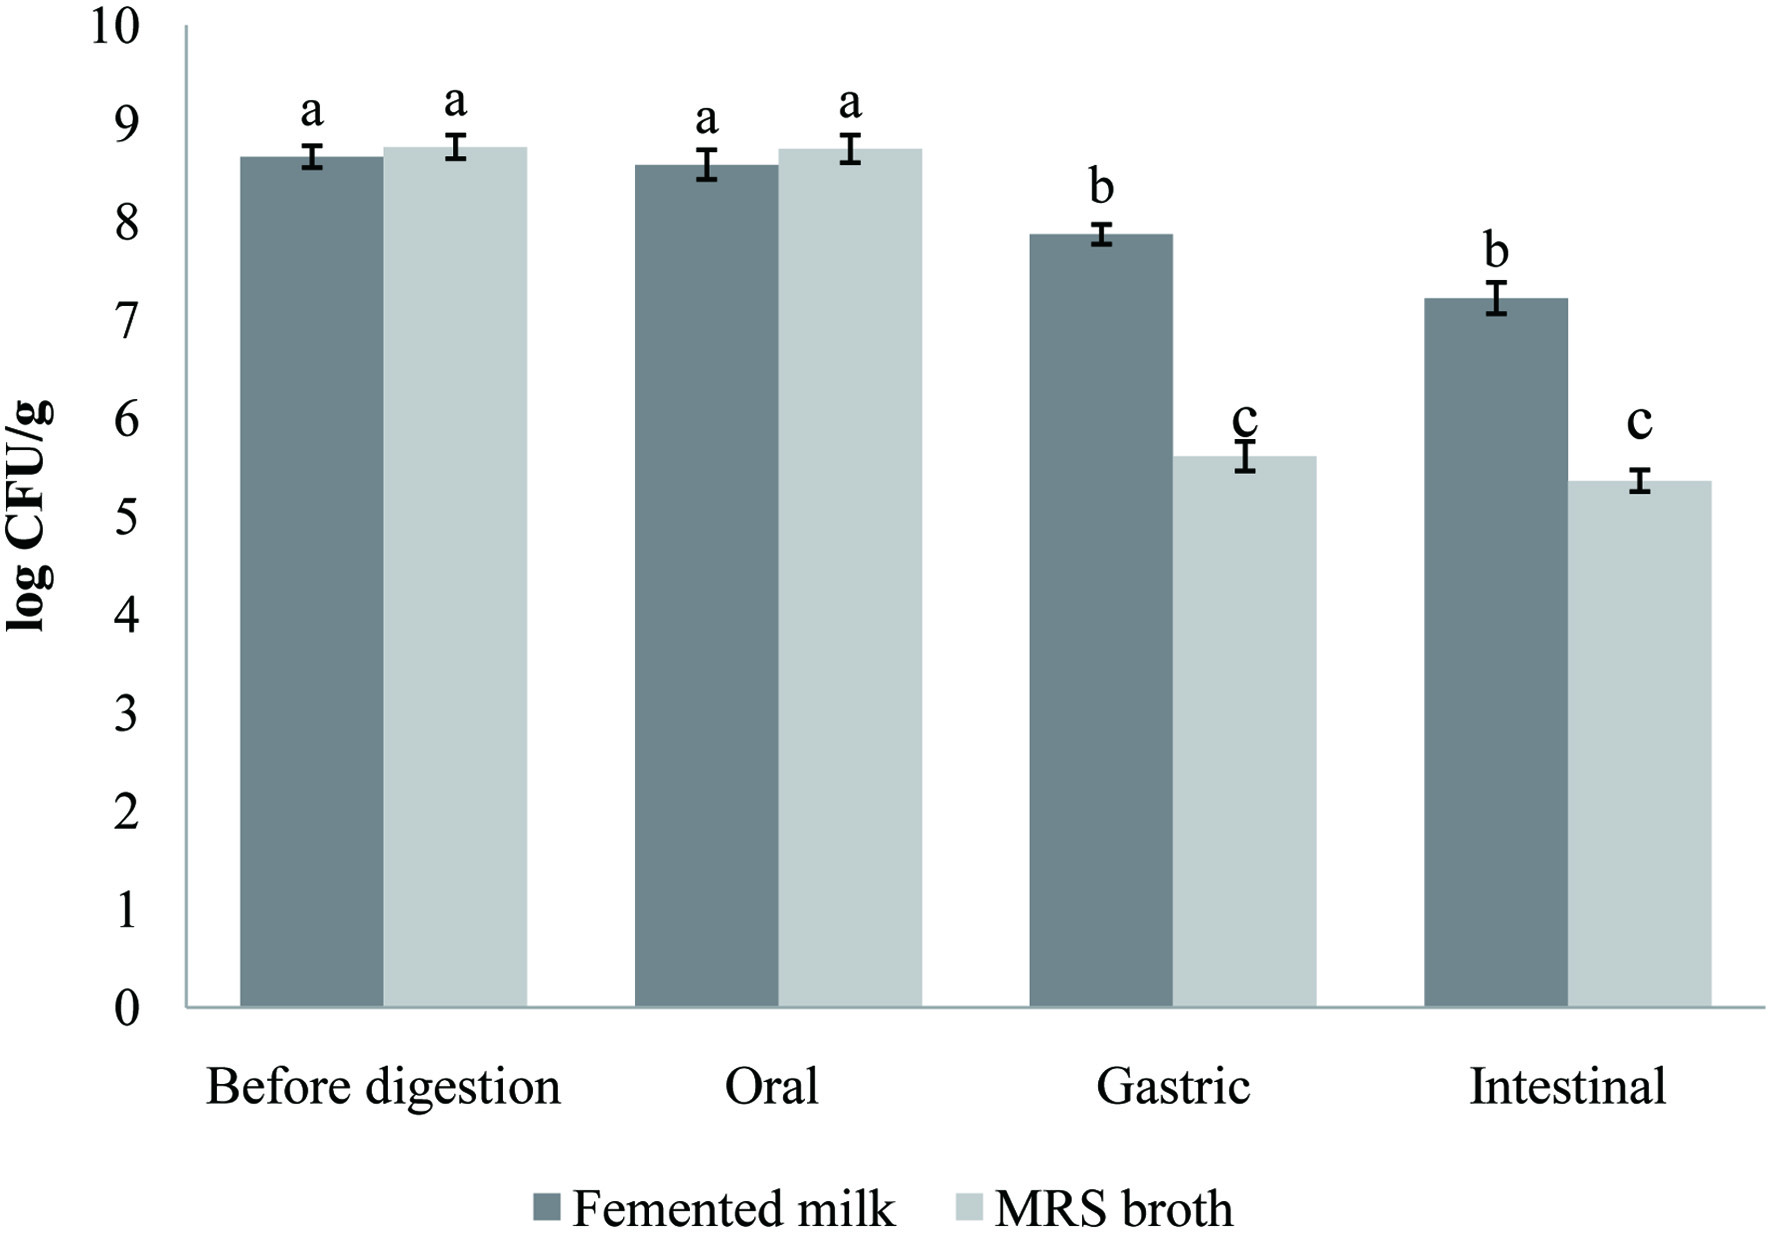
Figure 3. Survival of both probiotic strain (Lb. brevis B13 and B38) in carob fermented milk (FCP12) during the simulated gastrointestinal digestion. Small letters indicate a statistically significant difference between before the in vitro digestion counts and counts at each digestion step.
Figure 4.
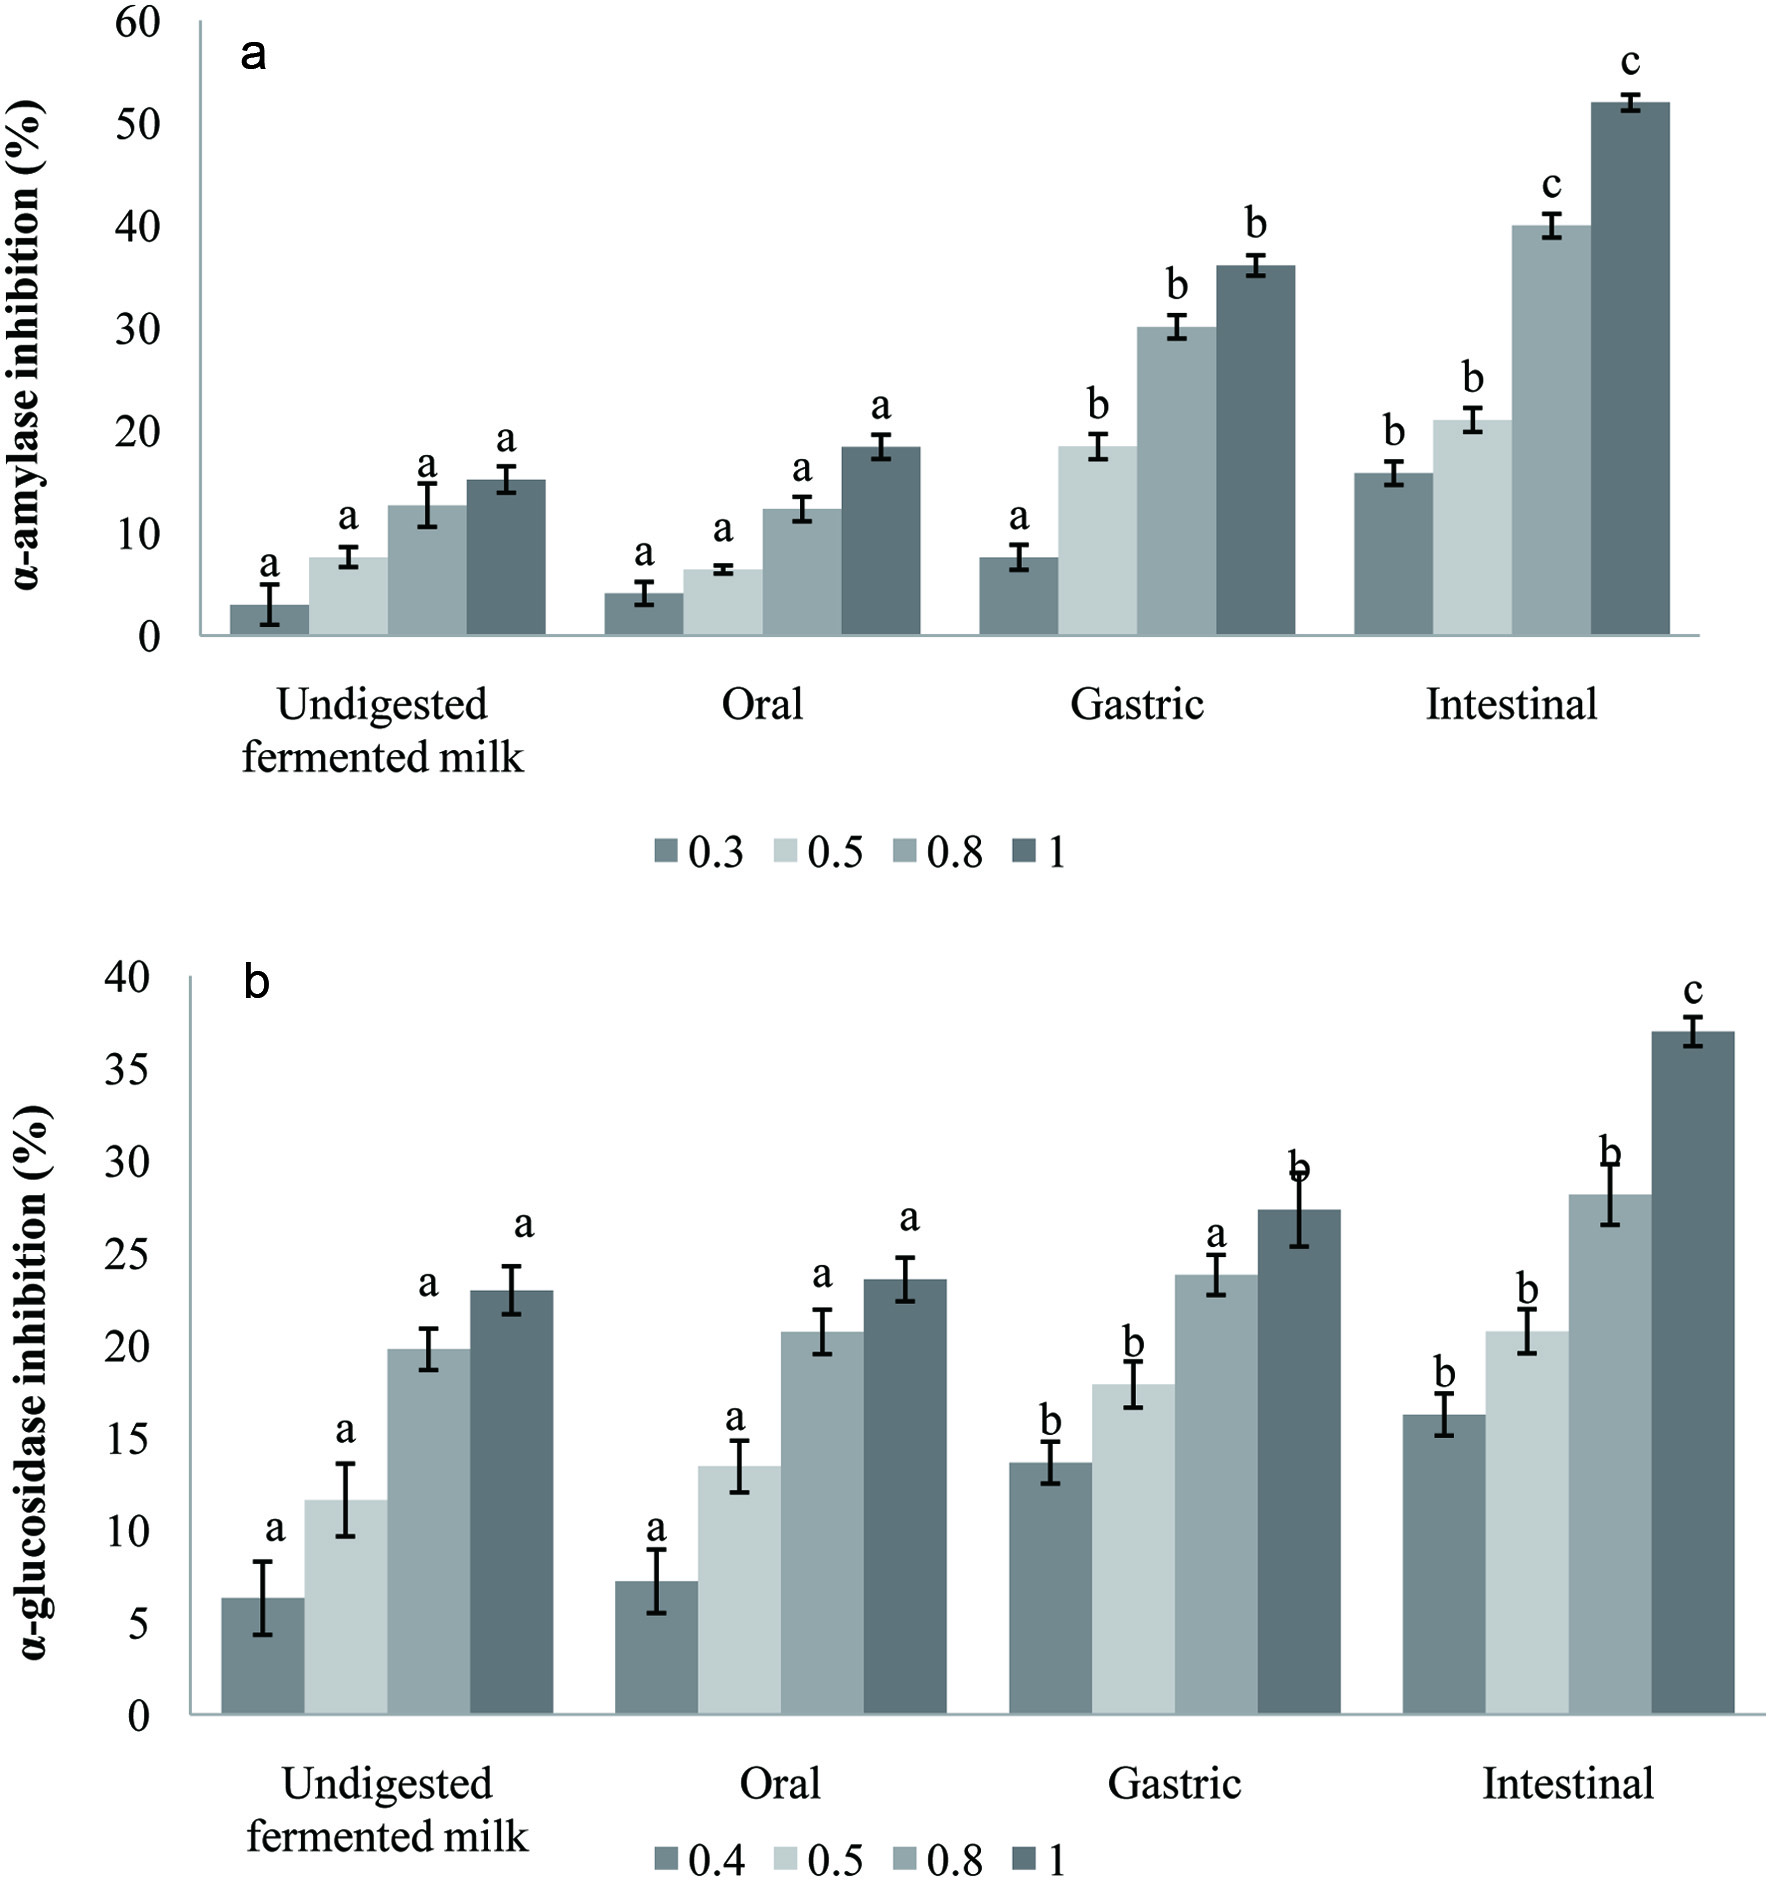
Figure 4. α-amylase (a) and α-glucosidase (b) inhibition (%) of carob fermented milk (FCP12) and its digested fractions. Small letters indicate significant differences before and during digestion steps for each tested concentration (0.3, 0.4, 0.5, 0.8 and 1 mg/mL).

Tables

Table 1. Experimental design for carob powder addition in fermented milks
 
FormulationPrebioticSample coding
SM: skim milk, F: fermented milk with only yogurt starter cultures, C: carob powder, I: inulin, FC: fermented milk with carob powder, FI: fermented milk with Inulin, P1: probiotic 1 (Lb. brevis B13), P2: probiotic 2 (Lb. brevis B38), P12: P1 + P2. First column represents the recipe of 4 different treatments for each row; control group (top row), Carob powder added milk (middle row) and inulin added milk (last row). The second column represents what type of prebiotic addition to the formulations; “0” means no addition, “C” means carob powder addition, and “I” means inulin addition. The third column represents the coding for 4 different treatments for each sample group in 3 rows.
SM + Lc. lactis C150F
F + Lb. brevis B130FP1
F + Lb. brevis B380FP2
F + Lb. brevis B13 + Lb. brevis B380FP12
SM + Lc. lactis C15CFC
F + Lb. brevis B13CFCP1
F + Lb. brevis B38CFCP2
F + Lb. brevis B13 + Lb. brevis B38CFCP12
SM + Lc. lactis C15IFI
F + Lb. brevis B13IFIP1
F + Lb. brevis B38IFIP2
F + Lb. brevis B13 + Lb. brevis B38IFIP12


Table 2. Probiotic Lb. brevis (P1 and P2) viable counts (log CFU/mL) in fermented milks during storage period (4 °C)*
 
Fermented milksDay 0Day 1Day 7Day 14Day 21Day 28
*Values expressed in log CFU/mL as mean ± standard deviation (n = 3).A,B,C Different capital letters in a column indicates significant differences between fermented milk supplemented with different prebiotics (P < 0.05); a,b,c,d Different lowercase letters in a row for each fermented milk denote significant differences during storage period (P < 0.05). F: fermented milk without prebiotic addition including P1/P2, FC: fermented milk with carob powder including P1/P2, FI: fermented milk with inulin powder including P1/P2.
FP16.43 ± 0.11aA6.42 ± 0.09aA6.35 ± 0.08abA6.28 ± 0.09bA6.17 ± 0.04cA6.04 ± 0.25dA
FP26.39 ± 0.09aA6.40 ± 0.10aA6.38 ± 0.12aA6.21 ± 0.10bA6.01 ± 0.04cA5.92 ± 0.05cA
FP126.28 ± 0.12aA6.26 ± 0.08aA6.11 ± 0.25bA6.05 ± 0.04bA5.82 ± 0.13cA5.74 ± 0.12cA
FCP18.68 ± 0.12aB8.69 ± 0.10aB8.80 ± 0.13bB8.79 ± 0.04bB8.69 ± 0.09bB8.28 ± 0.09cB
FCP28.61 ± 0.18aB8.60 ± 0.09aB8.79 ± 0.08bB8.81 ± 0.11bB8.70 ± 0.09bB8.26 ± 0.14cB
FCP128.66 ± 0.11aB8.65 ± 0.05aB8.98 ± 0.08bB8.93 ± 0.12bB8.89 ± 0.25bB8.58 ± 0.21cB
FIP17.67 ± 0.05aC7.65 ± 0.05aC7.57 ± 0.09aC7.41 ± 0.05abC7.30 ± 0.25bC7.27 ± 0.07bC
FIP27.69 ± 0.18aC7.70 ± 0.11aC7.64 ± 0.12aC7.47 ± 0.12bC7. 26 ± 0.07cC6.81 ± 0.14dC
FP127.61 ± 0.08aC7.60 ± 0.11aC7.53 ± 0.21aC7.46 ± 0.13aC6.82 ± 0.15bC6.43 ± 0.05cC


Table 3. The changes of physico-chemical properties of different fermented milks during refrigerated storage*
 
Fermented milkspHTitrable acidity (%)Viscosity (cP)
Day 1Day 14Day 28Day 1Day 14Day 28Day 1Day 14Day 28
*Values were expressed as mean ± standard deviation (n = 3). A,B,C Different capital letters in a column denote significant differences between fermented milk supplemented with different prebiotics (P < 0.05); a,b,c Different lowercase letters in a row for each fermented milk denote significant differences during storage period (P < 0.05). Abbreviations are: F: fermented milk without prebiotic addition including P1&P2, FC: fermented milk with carob powder including P1&P2, FI: fermented milk with inulin powder including P1&P2.
FP14.71 ± 0.10aA4.56 ± 0.02abA4.49 ± 0.07bA0.51 ± 0.12aA0.59 ± 0.05abA0.67 ± 0.10bA1,102 ± 0.08aA1,167 ± 0.15aA1,218 ± 0.16bA
FP24.70 ± 0.04aA4.58 ± 0.10bA4.50 ± 0.04bA0.50 ± 0.08aA0.57 ± 0.10aA0.66 ± 0.13aA1,104 ± 0.06aA1,170 ± 0.16aA1,217 ± 0.12bA
FP124.69 ± 0.03aA4.58 ± 0.11aA4.42 ± 0.11bA0.52 ± 0.04aA0.61 ± 0.12aA0.69 ± 0.08aA1,107 ± 0.12aA1,178 ± 0.12aA1,224 ± 0.08bA
FCP14.57 ± 0.03aB4.46 ± 0.07aB4.35 ± 0.03bB0.69 ± 0.08aB0.80 ± 0.08bB0.96 ± 0.04cB1,336 ± 0.14aB1,368 ± 0.09aB1,408 ± 0.14bB
FCP24.58 ± 0.04aB4.48 ± 0.05aB4.38 ± 0.03bB0.69 ±0.10aB0.79 ± 0.10bB0.91 ± 0.13cB1,324 ± 0.13aB1,360 ± 0.16aB1,398 ± 0.13bB
FCP124.50 ± 0.03aB4.41 ± 0.03aB4.33 ± 0.10bB0.79 ± 0.06aB0.87 ± 0.12bB1.10 ± 0.20cB1,343 ± 0.12aB1,373 ± 0.15aB1,423 ± 0.14bB
FIP14.60 ± 0.05aC4.52 ± 0.06aA4.41 ± 0.08bA0.56 ± 0.10aA0.76 ± 0.09bB0.83 ± 0.08bC1,203 ± 0.10aC1,271 ± 0.08aC1,301 ± 0.12bC
FIP24.61 ± 0.04aC4.55 ± 0.12aA4.43 ± 0.07bA0.54 ± 0.10aA0.75 ± 0.05bB0.81 ± 0.05bC1,200 ± 0.16aC1,268 ± 0.14aC1,298 ± 0.08bC
FP124.60 ± 0.04aC4.50 ± 0.10aA4.39 ± 0.02bAB0.60 ± 0.12aA0.78 ± 0.10bB0.89 ± 0.14bC1,218 ± 0.14aC1,276 ± 0.22bC1,324 ± 0.07cC


Table 4. Phenolic compounds of carob fermented milk (FCP12) during refrigerated storage (4 °C)*
 
Phenolic compoundsCarob powderDay 0Day 1Day 14Day 28
*Values are means of triplicates ± standard deviations (µg/g of fermented milk sample). Means followed by the different letters (a,b) in the same row represent a statistically significant difference (p < 0.05). Nd: not detected.
Gallic acid162.50 ± 0.12102.35 ± 0.14a100.82 ± 0.17a112.41 ± 0.07a78.06 ± 0.10b
Proto-catechuic acid39.19 ± 0.0424.71 ± 0.04a21.20 ± 0.08a19.64 ± 0.11a10.27 ± 0.09a
Chlorogenic acid54.12 ± 0.1133.67 ± 0.24a34.18 ± 0.20a35.21 ± 0.12a26.14 ± 0.07a
Caffeic acidNdNdNdNdNd
p-coumaric acid12.77 ± 0.118.11 ± 0.18a8.10 ± 0.12a11.04 ± 0.06aNd
Ferulic acid13.44 ± 0.127.47 ± 0.14a7.89 ± 0.08a10.41 ± 0.07a3.75 ± 0.14b
o-coumaric acid11.07 ± 0.046.33 ± 0.20a5.47 ± 0.11a4.15 ± 0.08aNd
Trans- cinnamic acid42.40 ± 0.1524.10 ± 0.11a24.85 ± 0.22a18.47 ± 0.07a10.63 ± 0.15b
Total phenolic acids (TPA)335.49 ± 0.18206.74 ± 0.14a202.51 ± 0.17a211.33 ± 0.17a128.85 ± 0.16b
(+)-Catechin11.02 ± 0.038.23 ± 0.10a8.21 ± 0.11a9.04 ± 0.11aNd
Rutin118.36 ± 0.0288.76 ± 0.15a89.06 ± 0.08a89.86 ± 0.08a64.07 ± 0.20b
Myricetin18.17 ± 0.0410.53 ± 0.11a10.50 ± 0.14a8.12 ± 0.15ab5.17 ± 0.08b
Isoquercitrin24.47 ± 0.0615.20 ± 0.14a15.18 ± 0.15a15.89 ± 0.14a7.57 ± 0.11b
Total flavonoids (TF)172.02 ± 0.14122.72 ± 0.16a122.95 ± 0.18a122.91 ± 0.17a76.81 ± 0.11b
Total phenolics (TPA+TF)507.51 ± 0.23329.46 ± 0.20a325.46 ± 0.20a334.24 ± 0.20a205.66 ± 0.19b


Table 5. Phenolic compounds of carob fermented milk (FCP12) during in vitro digestion*
 
Phenolic compoundsCarob powderBFOralGastricIntestinalBioaccessibility (%)
*Results are expressed as μg of individual compound in 1 g of carob fermented milk. Means followed by the different letters (a,b) in the same row represent a statistically significant difference (p < 0.05). BF: Before digestion. Nd: not detected/determined?
Gallic acid162.50 ± 0.12102.35 ± 0.14a104.56 ± 1.02a234.04 ± 1.03b452.12 ± 0.99c441.74
Proto-catechuic acid39.19 ± 0.0424.71 ± 0.04a24.53 ± 1.02a44.76 ± 0.99b65.49 ± 1.05c265.03
Chlorogenic acid54.12 ± 0.1133.67 ± 0.24a36.78 ± 0.05a78.23 ± 1.02b102.76 ± 0.75c305.19
Caffeic acidNdNdNdNd6.45 ± 0.08aNd
p-coumaric acid12.77 ± 0.118.11 ± 0.18a10.02 ± 0.08a16.06 ± 0.45a21.12 ± 0.98a260.41
Ferulic acid13.44 ± 0.127.47 ± 0.14a8.45 ± 0.99a15.17 ± 0.87b10.23 ± 0.07a136.94
o-coumaric acid11.07 ± 0.046.33 ± 0.20a5.33 ± 0.05aNdNdNd
Trans- cinnamic acid42.40 ± 0.1524.10 ± 0.11a26.12 ± 0.08a56.58 ± 0.99b67.44 ± 1.05b279.83
Total phenolic acids (TPA)335.46 ± 0.21206.74 ± 0.15a215.79 ± 0.17a444.84 ± 0.21b725.61 ± 0.24cNd
(+)-Catechin11.02 ± 0.038.23 ± 0.10a7.49 ± 0.08a26.19 ± 0.08b40.02 ± 1.05c486.26
Rutin118.36 ± 0.0288.76 ± 0.15a90.02 ± 0.10a128.73 ± 0.88b264.14 ± 1.10c297.58
Myricetin18.17 ± 0.0410.53 ± 0.11a12.37 ± 0.08a28.21 ± 0.09b35.12 ± 1.00b333.52
Isoquercitrin24.47 ± 0.0615.20 ± 0.14a16.75 ± 0.66a8.12 ± 0.06b5.36 ± 0.09b35.26
Total flavonoids (TF)172.02 ± 0.14122.72 ± 0.10a126.63 ± 0.11a191.25 ± 0.16b344.64 ± 0.14cNd
Total phenolics (TPA+TF)510.88 ± 0.23329.46 ± 0.17a342.42 ± 0.16a636.09 ± 0.20b1,070.25 ± 0.25cNd


Table 6. Antibacterial activity in the fermented milk supplemented with 4% carob powder*
 
Inhibitory zone diameter
L. monocytogenesS. aureusS. typhimuriumE. coli
*Values are represented as mean ± SD (n=3). Means followed by the different letters (a,b) in the same row indicate a statistically significant difference (p < 0.05).
Control11 ± 0.2a9 ± 0.3a10 ± 0.2a10 ± 0.3a
Fermented milk (FCP12)12 ± 0.4b14 ± 0.2b11 ± 0.1b13 ± 0.2b