Figure 1.
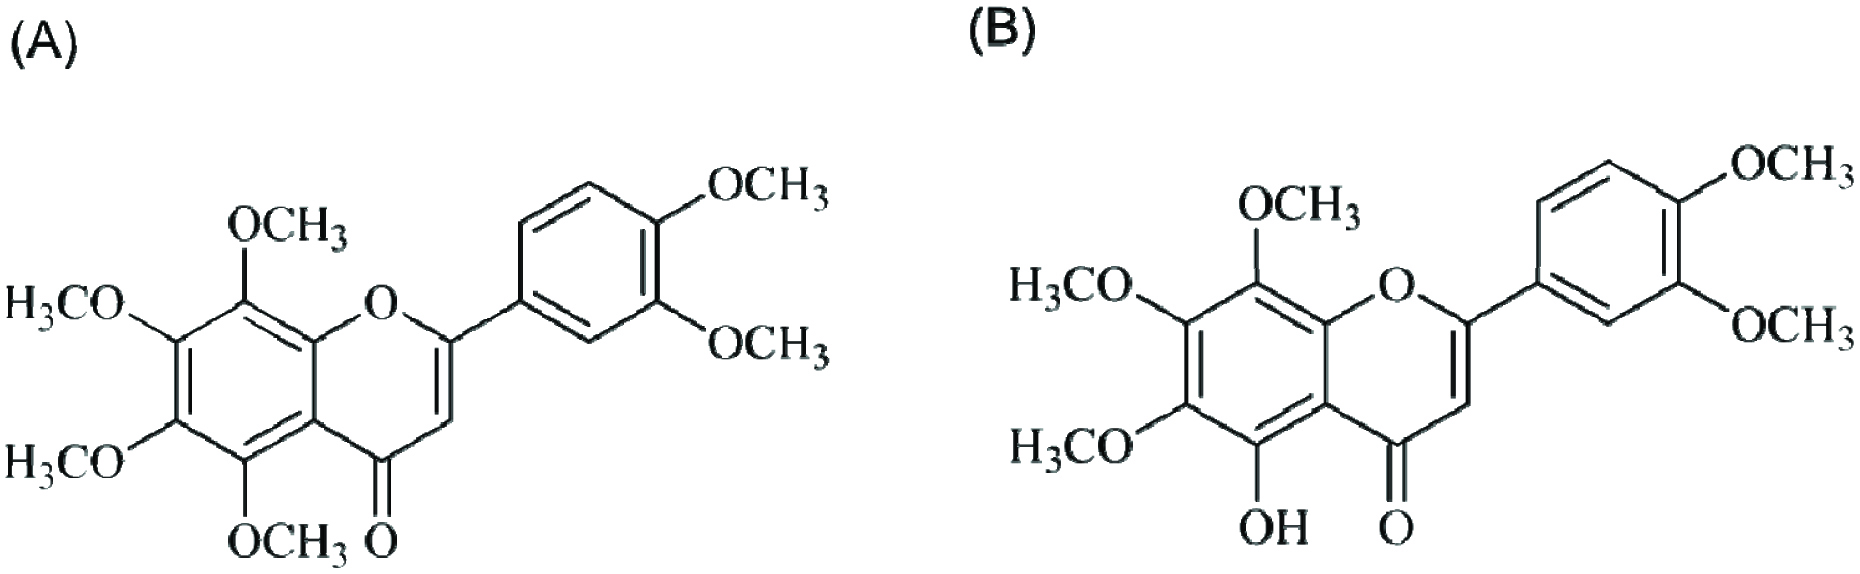
Structures of (A) nobiletin and (B) 5-demethylnobiletin.
| Journal of Food Bioactives, ISSN 2637-8752 print, 2637-8779 online |
| Journal website www.isnff-jfb.com |
Original Research
Volume 2, Number , June 2018, pages 98-103
5-Demethylnobiletin is more effective than nobiletin in preventing AOM/DSS-induced colorectal carcinogenesis in ICR mice
Figures
Structures of (A) nobiletin and (B) 5-demethylnobiletin.
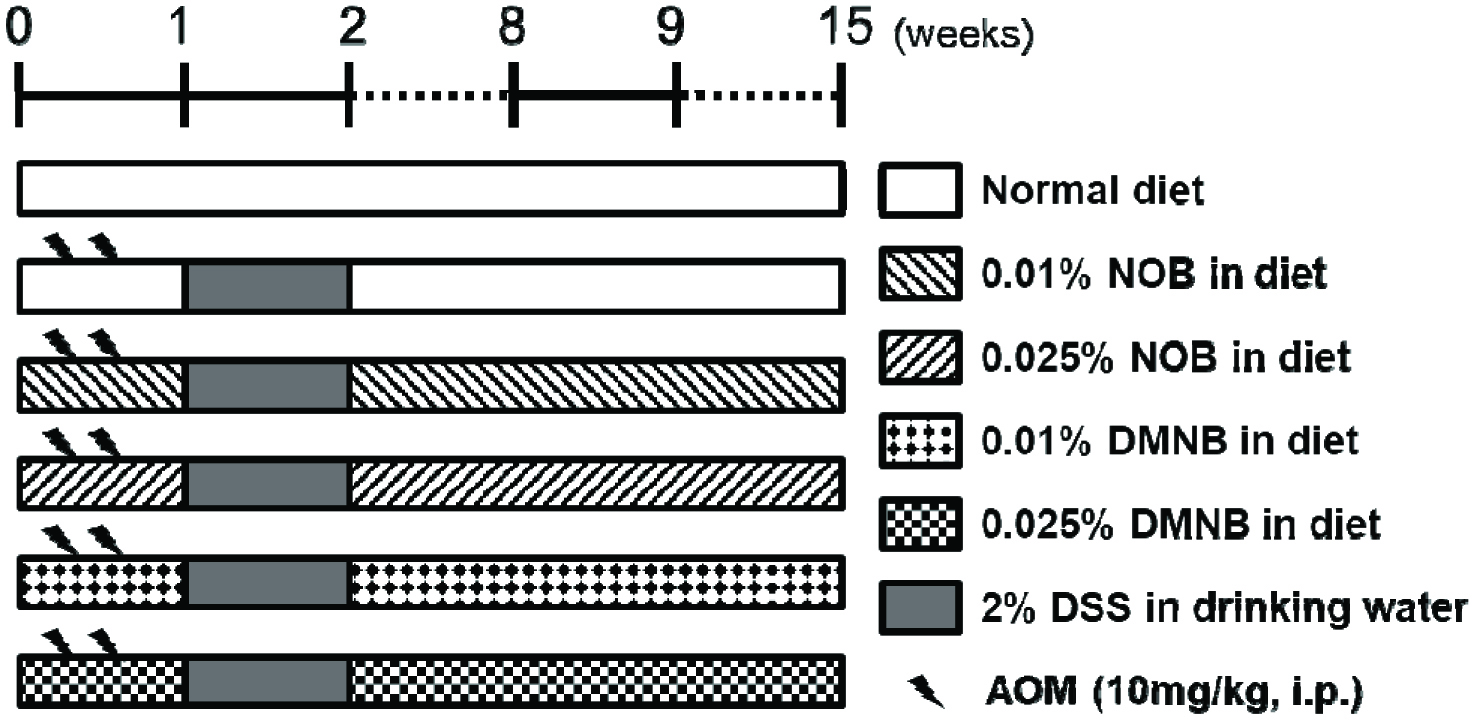
Experimental design of AOM/DSS-induced colorectal tumorigenesis in male ICR mice for 15 weeks.
Effects of NOB or DMNB prevented AOM/DSS-induced colorectal tumorigenesis.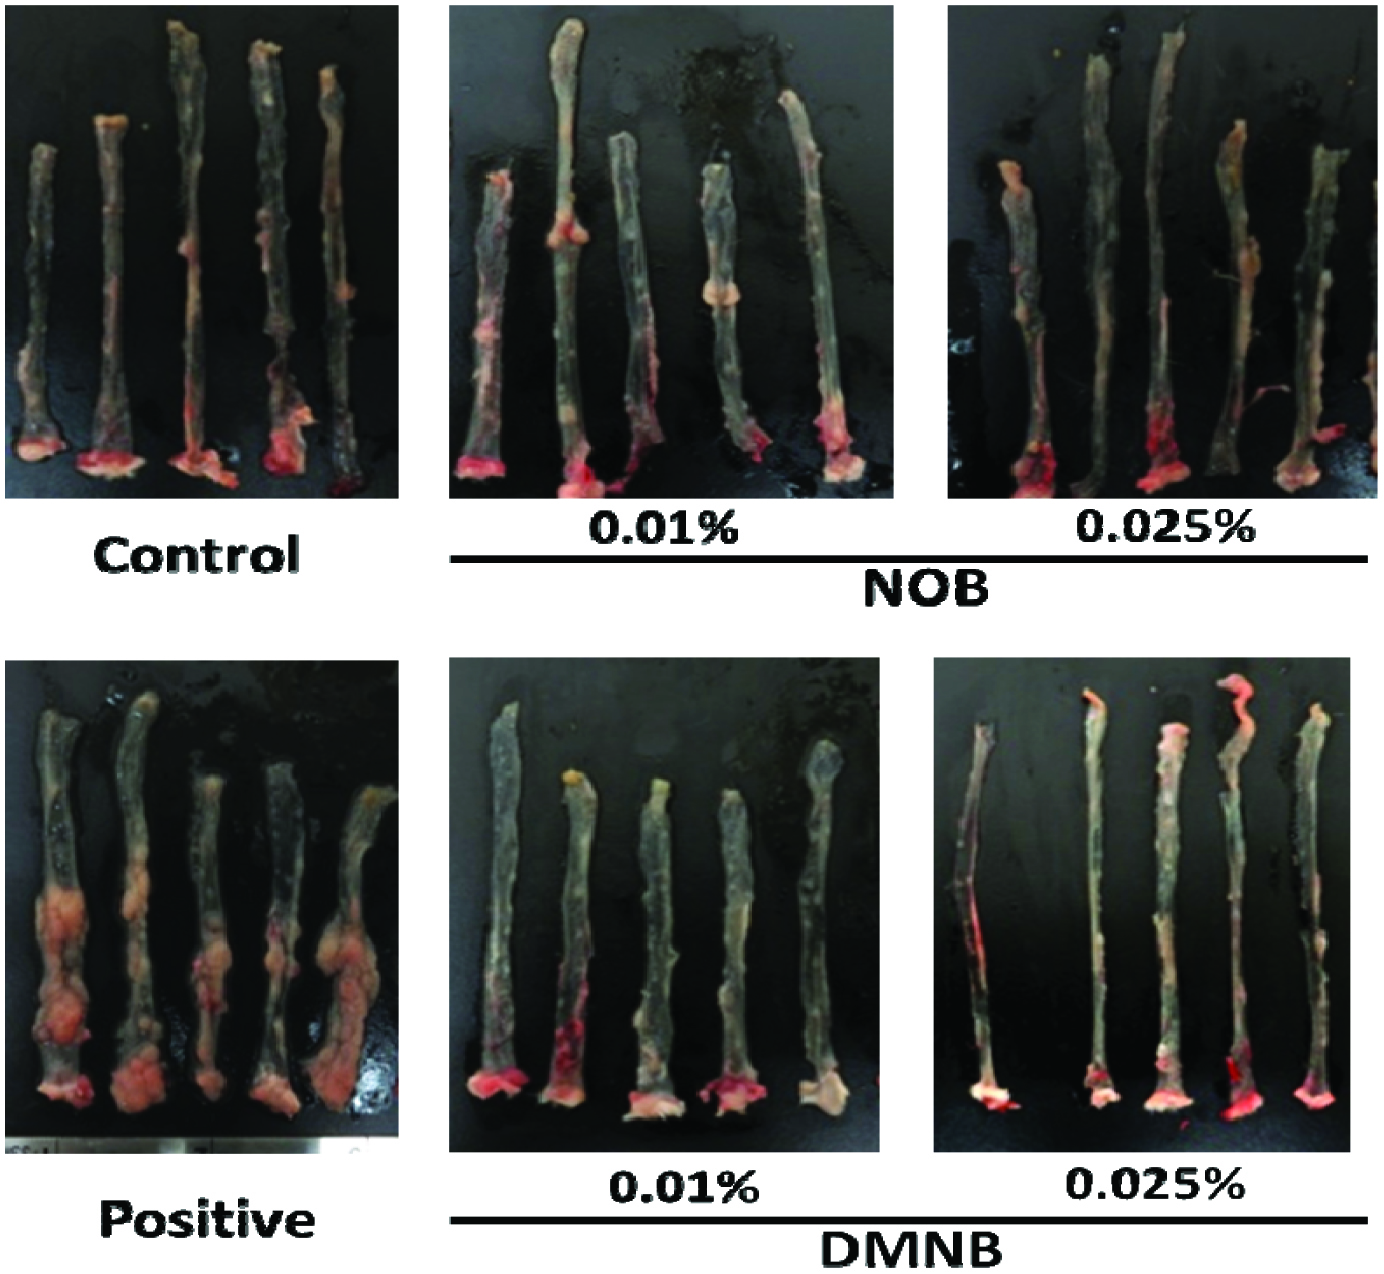
Morphology of colonic mucosal surface of AOM/DSS-treated mice.
(A) control group (B) AOM/DSS group (C) NOB and (D) DMNB group. Positive: AOM/DSS.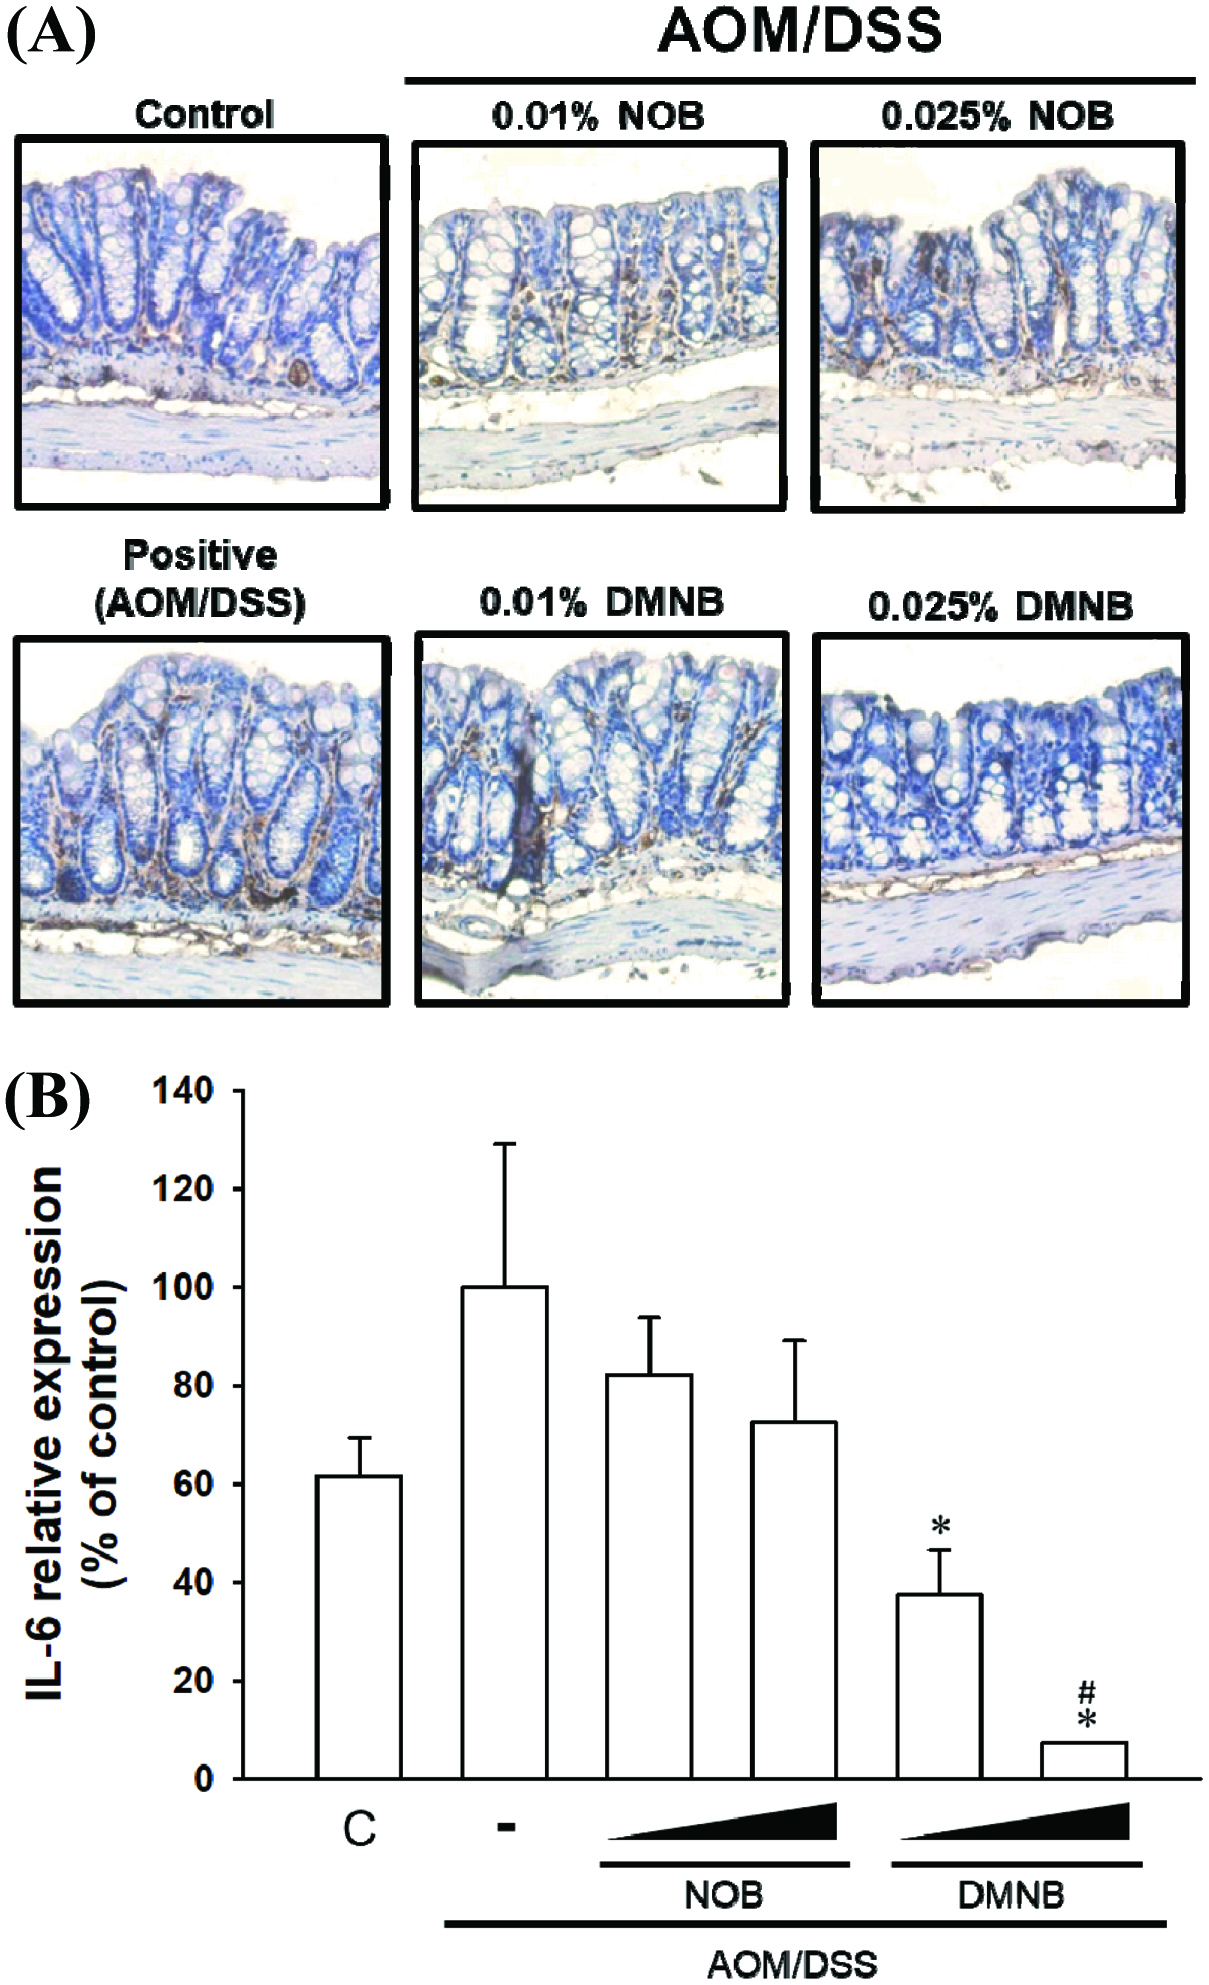
Inhibitoy effect of NOB and DMNB on AOM/DSS-induced IL-6 expression and distribution in colorectal tissue.
(A) Colonic tissues were embedded in paraffin and visualized by immunohistochemical (IHC) analysis using IL-6 antibody demonstrated as dark stain. (B) Quantification of IL-6-labeling index (%) was determined by ImageJ (National Institute of Health). *p < 0.05, compared with control group. #p < 0.05, compared with AOM/DSS group.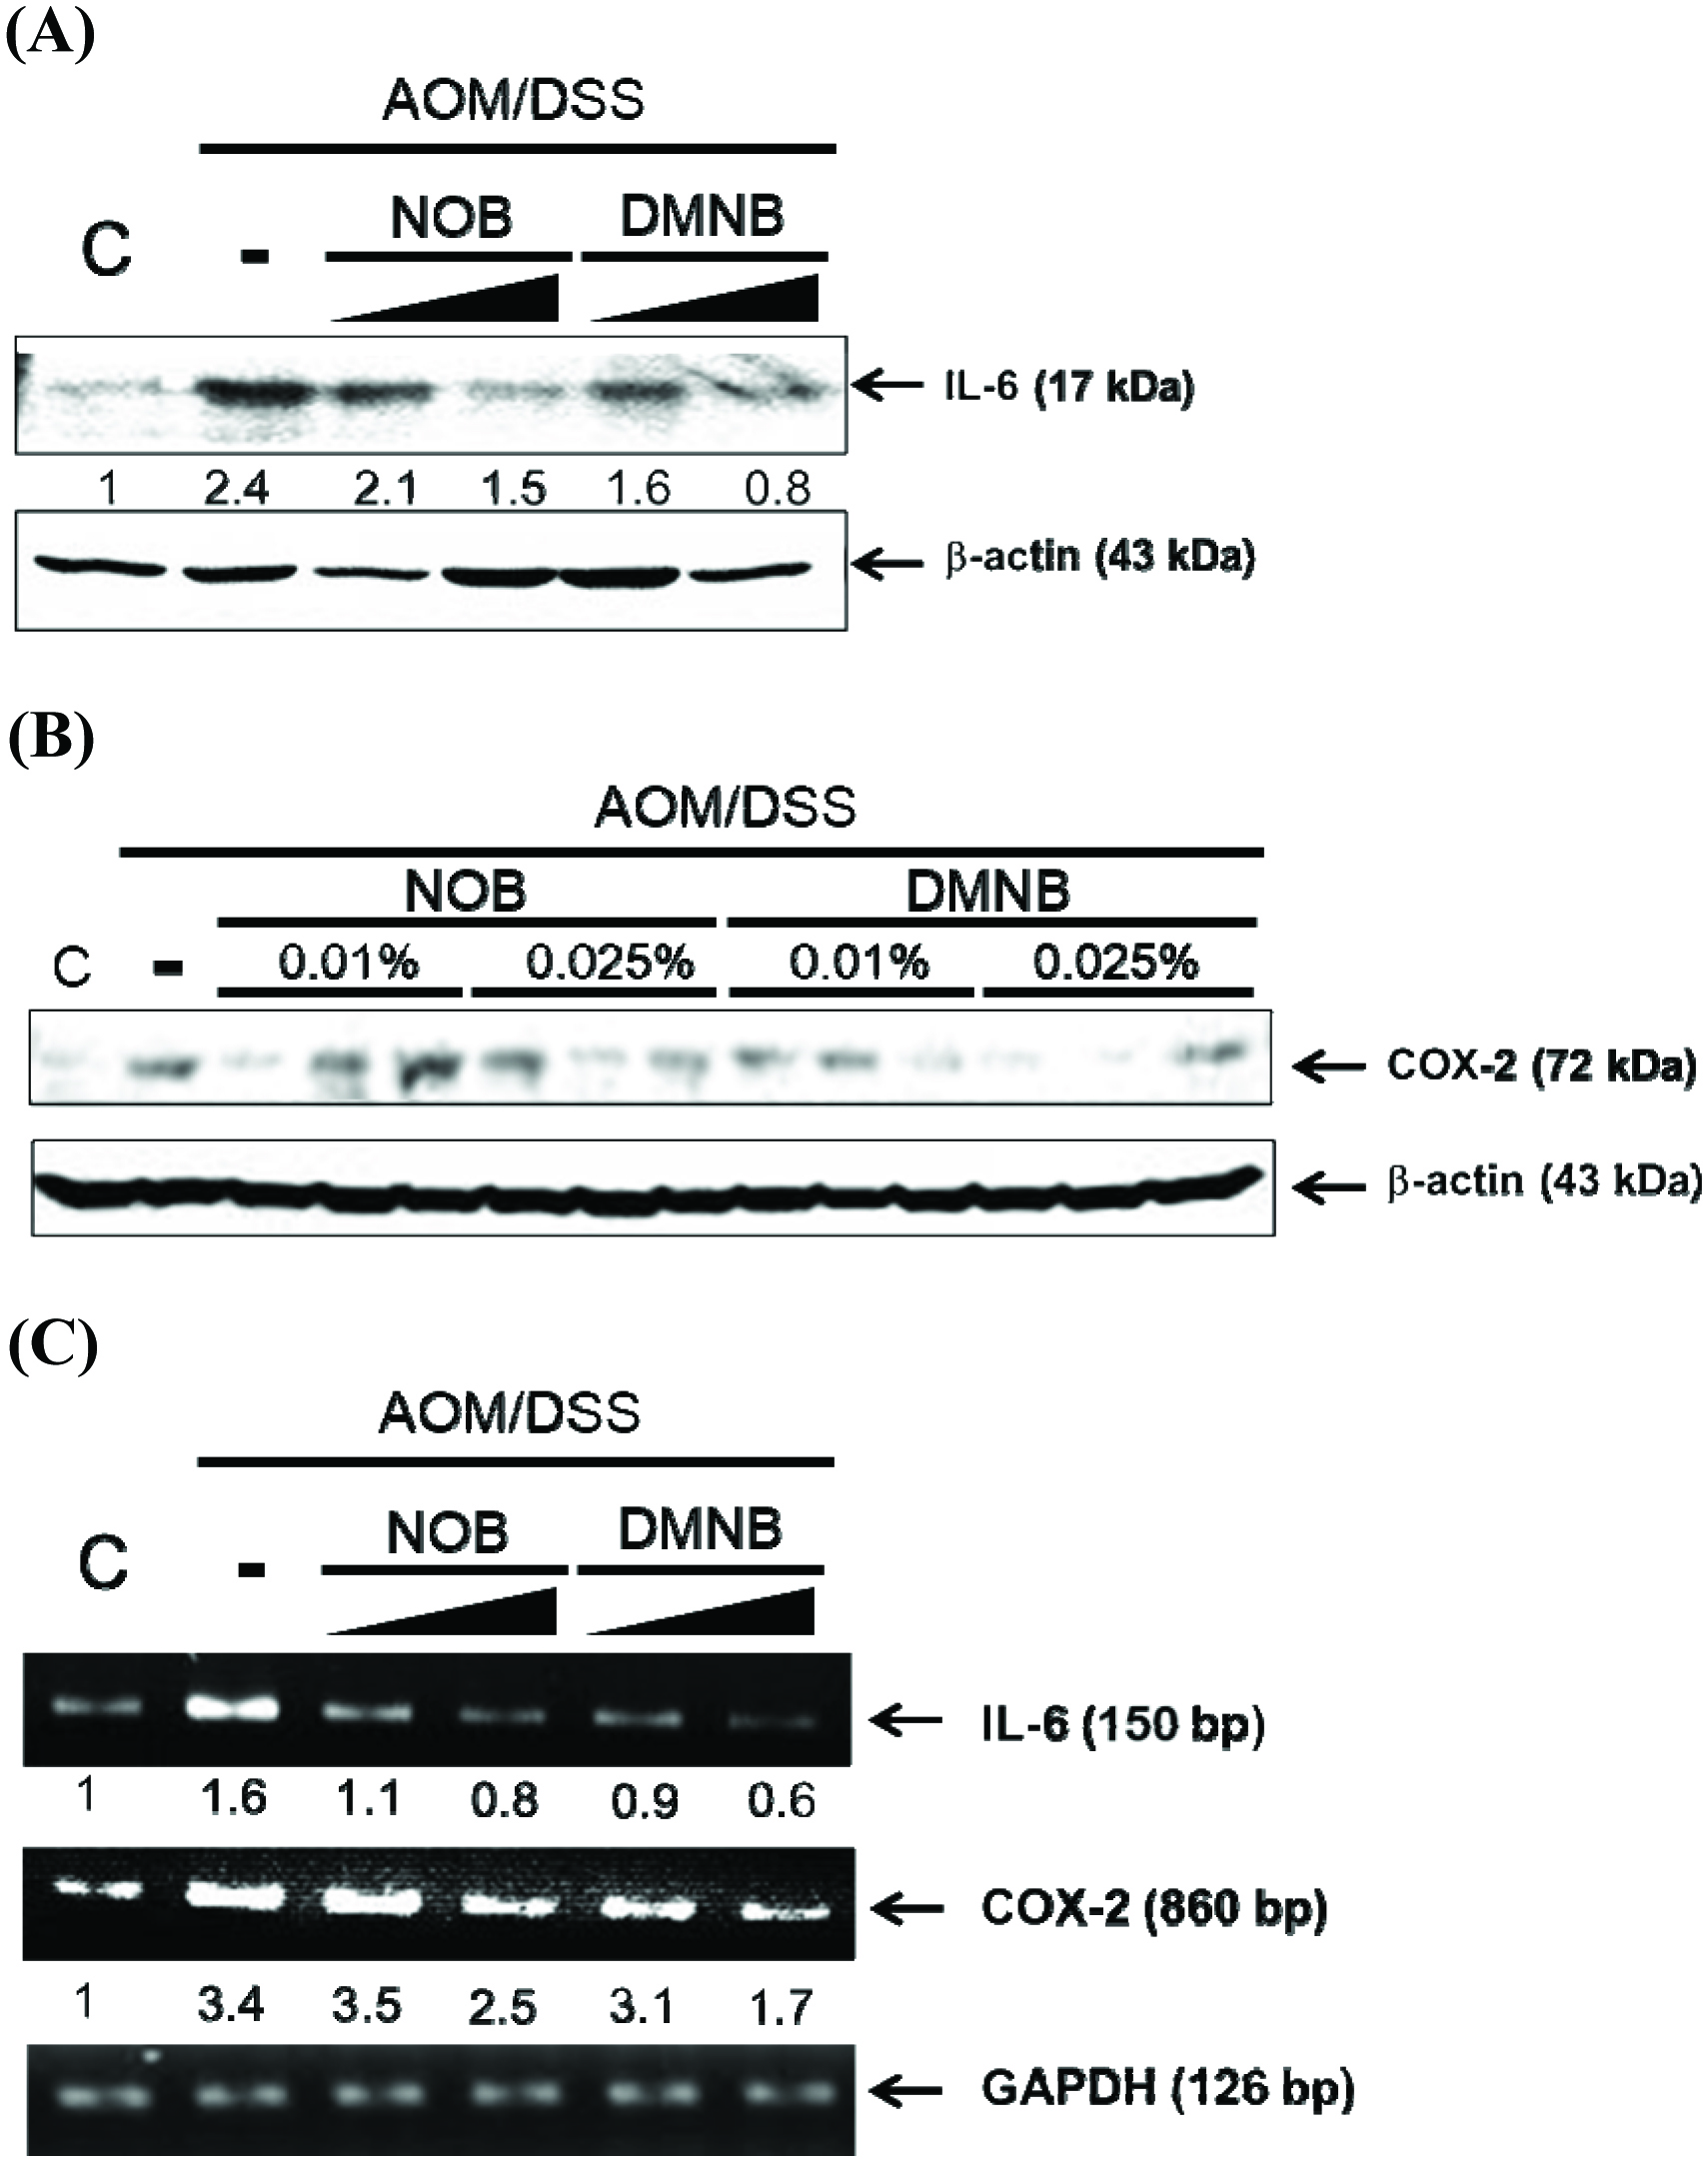
The NOB and DMNB significantly prevented AOM/DSS-induced inflammatory responses in colonic mucosa tissue.
Total protein lysates from colonic mucosa detected the expression level of IL-6 (A) and COX-2 (B) by western blot. (C) Reverse transcriptional PCR analyzed colonic mucosa mRNA expression level of IL-6 and COX-2.Tables
| Groups | Body Weight (g) | Relative organ weight (g) | ||
|---|---|---|---|---|
| Liver | Kidney | Spleen | ||
| The data of body weight are expressed as the mean ± SD (n = 12) and were statistically analyzed using a one-way ANOVA followed by Duncan’s multiple-range test. Different letters (a−b) represent significant differences among groups, p < 0.05. The data of relative organ weight performed by student’s t-tests, *p < 0.05, compared with control group. | ||||
| Control | 50.7 ± 3.3a | 2.27 ± 0.16 | 0.85 ± 0.10 | 0.12 ± 0.04 |
| AOM/DSS | 43.3 ± 3.3b | 2.25 ± 0.36 | 0.84 ± 0.09 | 0.23 ± 0.09* |
| AOM/DSS + 0.01% NOB | 46.8 ± 4.8c | 2.12 ± 0.31 | 0.85 ± 0.07 | 0.13 ± 0.03 |
| AOM/DSS + 0.025% NOB | 48.8 ± 3.7ac | 2.16 ± 0.22 | 0.86 ± 0.10 | 0.15 ± 0.08 |
| AOM/DSS + 0.01% DMNB | 47.6 ± 4.6ac | 2.09 ± 0.26 | 0.85 ± 0.13 | 0.13 ± 0.03 |
| AOM/DSS + 0.025% DMNB | 48.2 ± 3.2ac | 2.10 ± 0.22 | 0.84 ± 0.09 | 0.13 ± 0.05 |
| Groups | Colon length (mm) | NO. of Tumor/colon | ||
|---|---|---|---|---|
| Small | Larger | Total | ||
| The data of body weight are expressed as the mean ± SD (n = 12) and were statistically analyzed using a one-way ANOVA followed by Duncan’s multiple-range test. Different letters (a−b) represent significant differences among groups, p < 0.05. | ||||
| Control | 87.1 ± 5.7a | 1.1 ± 1.1a | 0.0 ± 0.0a | 1.1 ± 1.1a |
| AOM/DSS | 67.4 ± 6.0b | 10.4 ± 6.2b | 14.0 ± 10.4b | 24.4 ± 8.5b |
| AOM/DSS + 0.01% NOB | 78.3 ± 14.3bc | 7.8 ± 1.8ab | 2.4 ± 2.8a | 10.2 ± 3.8c |
| AOM/DSS + 0.025% NOB | 90.6 ± 14.4ac | 7.4 ± 2.1c | 1.4 ± 2.0a | 8.9 ± 2.5c |
| AOM/DSS + 0.01% DMNB | 81.2 ± 10.2ac | 6.9 ± 2.8c | 1.1 ± 1.4a | 8.0 ± 3.6c |
| AOM/DSS + 0.025% DMNB | 101.3 ± 11.4c | 6.6 ± 1.9c | 1.0 ± 2.0a | 7.6 ± 3.1c |