| Journal of Food Bioactives, ISSN 2637-8752 print, 2637-8779 online |
| Journal website www.isnff-jfb.com |
Original Research
Volume 25, March 2024, pages 25-41
A comprehensive characterization of phenolics, amino acids and other minor bioactives of selected honeys and identification of botanical origin markers
Yan Zhua, Ronghua Liua, Lili Matsa, Honghui Zhua, Joy Roasaa, b, Tauseef Khanc, d, e, Amna Ahmedc, d, e, Yolanda Brummera, Steve Cuia, John Sievenpiperc, d, e, f, g, D. Dan Ramdatha, Rong Tsaoa, *
aGuelph Research and Development Centre, Agriculture and Agri-Food Canada, 93 Stone Road West, Guelph, Ontario N1G 5C9, Canada
bDepartment of Food Science, University of Guelph, Guelph, Ontario N1G 2W1, Canada
cDepartment of Nutritional Sciences, Temerty Faculty of Medicine, University of Toronto, Toronto, Canada
dToronto 3D Knowledge Synthesis and Clinical Trials Unit, Clinical Nutrition, St Michaels Hospital, Toronto, Ontario, Canada.
eClinical Nutrition and Risk Factor Modification Centre, St Michaels Hospital, Toronto, Ontario, Canada
fDivision of Endocrinology and Metabolism, St Michaels Hospital, Toronto, Ontario, Canada
gLi Ka Shing Knowledge Institute, St Michaels Hospital, Toronto, Ontario, Canada
*Corresponding author: Rong Tsao, Guelph Research and Development Centre, Agriculture and Agri-Food Canada, 93 Stone Road West, Guelph, Ontario N1G 5C9, Canada. E-mail: rong.cao@agr.gc.ca
DOI: 10.31665/JFB.2024.18369
Received: January 4, 2024
Revised received & accepted: February 5, 2024
| Abstract | Top |
Phenolic and amino acid profiles along with organic acid, vitamin and mineral contents, major and minor sugars and enzyme activities of selected honey samples collected in North America were analyzed using different methods and potential markers of their botanical origin were identified. A total of 29 phenolic compounds were detected, of which some were found to be a good chemical markers to distinguish a genuine honey given its propolis origin. Quantitative data and principal component analysis showed that hesperidin, caffeic acid/isoferulic acid, and p-hydroxybenzoic acid/p-coumaric acid have the most positive relationship to the orange, alfalfa, and buckwheat honey, respectively, indicating their potential roles as chemical markers of these floral honeys. Free amino acid profiles were similar in all honeys except buckwheat which not only had significantly higher branched-chain amino acids but was the only floral honey that contained L-norvaline that was identified for the first time. The enzyme activities and the major and rare sugar composition helped explain the presence of the various organic acids in the honeys. Compositional data of these bioactives and other nutrients will not only serve as database information for honey derived from North America but also provide insightful knowledge for the underlining potential health benefits.
Keywords: Honey composition; Botanical origin; Phenolic compounds; Amino acids; L-norvaline; Rare sugar
| 1. Introduction | Top |
Honey is a natural sweetener produced from honeydew or flower nectar by bees (Olas, 2020). In addition to sugars, mainly glucose and fructose, honey contains a variety of other nutrients and bioactive compounds, including phenolics, proteins/amino acids, organic acids, vitamins, minerals and enzymes (da Silva et al., 2016; Machado De-Melo et al., 2018). Honey is a nutritious food that offers numerous health benefits (Battino et al., 2021; Zammit Young and Blundell, 2023). Its unique composition, particularly that of phenolic compounds and amino acids, makes it a valuable addition to a balanced diet.
Phenolic compounds are a class of naturally occurring compounds found in many plant-based foods. They are produced as secondary metabolites by plants and act as strong antioxidants to suppress oxidative stress, which has been linked to many adverse effects and chronic diseases such as obesity, metabolic disorders, type 2 diabetes, cardiovascular disease, and cancers (Battino et al., 2021; Cianciosi et al., 2018; Zammit Young and Blundell, 2023). In addition to their direct antioxidant function, phenolics have been shown to enhance antioxidant enzyme activities, inhibit production of pro-inflammatory cytokines, and directly attenuate oxidative stress-induced inflammatory signalling pathways, thereby reducing the risk of chronic diseases (Zhang and Tsao, 2016). Although relatively low in concentration, amino acids are another class of compounds found in honey with bioactive functions, mainly acting as precursors of protein synthesis and intermediates of various metabolic processes (Janiszewska et al., 2012).
Among honey products, floral honeys have garnered particular attention due to their specific composition and unique bioactivities. The documented health-promoting properties of such honeys have led to increased demand and high market value (Sultana et al., 2022). To determine the plant origin and differentiate adulterated products from natural honey, a melissopalynological strategy has been commonly used, using methods such as microscopic techniques to study the pollen contained in the honey. However, recent advances in analytical techniques capable of profiling honey constituents, such as carbohydrates, phenolic compounds, amino acids, volatile compounds, organic acids, proteins and nucleic acids, have immensely helped in providing insights on the nutrient and/or therapeutic characters of specific honey varieties, and identifying markers for discriminating the botanical origins of floral honeys (Wang et al., 2022). As a main source of phytochemicals, nectar-derived phenolic acids and flavonoids have therefore become good candidates for chemical markers of floral honeys. Previous studies have proposed hesperetin, kaempferol, and quercetin as botanical markers of citrus, rosemary, and sunflower honey, respectively (Toms-Barbern et al., 2001). p-Coumaric acid and p-hydroxybenzoic acids were also reported to be unique in buckwheat honey (Sergiel et al., 2014; Shen et al., 2019). Free amino acids in honey originate from both plants and honeybees. Except for the predominant proline which originates from the hypopharyngeal glands in the worker honeybee (Davies, 1978), some other free amino acids were identified as botanical markers. For examples, leucine, isoleucine, and tyrosine are major amino acids in buckwheat honey (Dimins et al., 2022), and asparagine is enriched in ilex honey (Params et al., 2006). A non-proteinogenic amino acid, -aminobutyric acid, was unique to chestnut-tree honey (Params et al., 2006).
Even when honeys shares the same botanical origin, their compositions could be influenced by a number of factors including geographic location, environmental condition, processing method, and storage condition (Hermosn et al., 2003), which add challenges in identifying the right chemical markers. High-resolution instrumental analysis in combination with multivariable statistical analysis can offer a unique solution to this problem. Moreover, use of multiple markers from different groups of honey constituents could improve the confidence level in discriminating different honeys.
Meanwhile, although chemical profiling of phenolics and in some cases, free amino acids of honeys of many countries has been studied, such data and other compositional information including total protein, vitamins, mineral and amino acid compositions, organic acids, rare sugars and enzyme activities is lacking for North American honey varieties. Contribution of these components to health benefits and usefulness of them as markers for honeys plant origin have not been studied for North American honeys. This study therefore aims to carry out a comprehensive analysis of the composition of four selected floral honeys, alfalfa (Medicago sativa), buckwheat (Fagopyrum esculentum), clover (Trifolium spp.), orange (Citrus sinensis), and one multifloral honey (wildflower honey) purchased in North America, to identify chemical markers for their botanical origins, and to provide a nutritional and bioactives database for further studies on the potential health benefits of honey.
| 2. Materials and methods | Top |
2.1. Samples, chemicals and reagents
Honey samples were provided by the US National Honey Board. Fifteen honey samples with five varieties including alfalfa (n = 3), buckwheat (n = 3), clover (n = 4), orange (n = 3), and wildflower (n = 2) were produced and collected between 2020 and 2022. Details on honey samples are in Table S1. All samples were stored at 20C before analysis.
Phenolic standards, including gallic acid, protocatechuic acid, neochlorogenic acid, p-hydroxybenzoic acid, vanillic acid, caffeic acid, chlorogenic acid, syringic acid, p-coumaric acid, trans-ferulic acid, isoferulic acid, o-coumaric acid, ellagic acid, hesperidin, myricetin, kaempferol-rutinoside, pinobanksin-5-methyl ether (P5ME), pinobanksin, quercetin, naringenin, luteolin, hesperetin, kaempferol, apigenin, isohamnetin, pinocembrin, chrysin, galangin, acacetin, 5-hydroxymethylfurfural (5-HMF), furfural, abscisic acid, 20 proteinogenic L-amino acids and L-norvaline, organic acid standards including acetic acid, citric acid, formic acid, gluconic acid, glutaric acid, glycolic acid, lactic acid, maleic acid, malic acid, malonic acid, oxalic acid, propionic acid, succinic acid, vitamin standards including ascorbic acid, riboflavin (B2), nicotinic acid (B3), pantothenic acid (B5), pyridoxine (B6), 2-ethylbutyric acid, glucose, fructose, sucrose, trehalose, kojibiose, maltose, isomaltose, turanose, palatinose, nigerose, melezitose. isomaltotriose and maltotriose, and other solvents and reagents including acetonitrile, formic acid, ammonium formate were obtained from Sigma-Aldrich (Oakville, ON, Canada). LC-MS grade methanol was obtained from Fisher Scientific (Ottawa, ON, Canada). Distilled and deionized water was purified in-house using a Milli-Q system (Bedford, MA, USA).
2.2. Extraction of 5-HMF, furfural, abscisic acid, and phenolic compounds
Phenolic extracts of honey were prepared using acidified aqueous methanol as previously described with modification (Zhang et al., 2017a). Briefly, honey samples were weighed and diluted to 30 % (w/v) solution with water and were acidified by formic acid to the final concentration of 1 % (v/v). 2-Hydroxy-4-methoxybenzoic acid was spiked in samples as an internal standard (IS) for evaluating the recovery efficiency of the extraction method. Twenty-five mL of acidified honey solution was then purified using OASIS HLB polymeric solid phase extraction cartridges (150 mg, Waters, Mississauga, ON, Canada) and eluted with 2 mL of 1 % (v/v) formic acid in methanol. The eluent was stored in 20C freezer before LC-MS analysis.
2.3. Analysis of 5-HMF, furfural, abscisic acid, and phenolic compounds by LC-MS/MS
LC-MS/MS analysis was performed using a Thermo Scientific Q-Exactive Orbitrap mass spectrometer coupled to a Vanquish Flex Binary UPLC System with a diode array detector (DAD) (Waltham, MA, USA). A Kinetex XB-C18 100A column (100 4.6 mm, 2.6 m, Phenomenex Inc., Torrance, CA, USA) was used. The binary mobile phase consisted of solvent A (99.9% H2O / 0.1% formic acid) and solvent B (94.9% methanol / 5% acetonitrile / 0.1% formic acid). The phenolic compounds and abscisic acid ([M-H] = m/z 263.1289) were analyzed by using negative ionization mode and 5-HMF ([M+H]+ = m/z 127.0390) and furfural ([M+H]+ = m/z 97.0286) were detected in positive ionization mode. The negative mode solvent gradient was: 05 min, 0% to 12% B; 515 min, 12% to 23% B; 1530 min, 23% to 50% B; 30 - 40 min, 50% to 80% B; 4042 min, 80% to 100% B; 4245 min, 100% B; 4546 min, 100% to 0% B; 4652 min, 0% B. The positive mode solvent gradient was: 010 min 2% B; 1011 min, 2% to 100% B; 1114 min, 100% B; 1415 min, 100% to 2% B; 1521 min, 2% B. The column temperature was set at 40C, the flow rate was 0.700 mL/min, and the injection volume was 2 L. UV peaks were monitored at 280 nm, 320 nm, 360 nm and 520 nm for the phenolic compounds. The spray voltages for both negative and positive modes were set at 4.5 kV. Mass spectrometry data were collected using DDMS2 method (TopN = 10, NCE = 30, intensity threshold was set at 1.0e5 counts) for compound identification, and with Full-MS mode for quantification. Data were visualized and analysed using Thermo FreeStyle 1.7PS2 software. Quantification was achieved using standard curves generated from the molecular ions of individual compounds in serial dilutions (0.00510 mg/L; r2 > 0.995).
2.4. Total protein content and analysis of free and hydrolyzed amino acids by HPLC
2.4.1. Total protein content
Honey samples were diluted to 30 % (w/v) solution by distilled water. The solution was filtered through a 0.22 m PVDF syringe filter to remove any insoluble materials. Protein in honey was separated by centrifuging at 5,000 g using an Amicon ultra centrifugal filter device with a molecular weight cut-off of 3,000 (Merck KGaA, Darmstadt, Germany) twice. The concentrated protein was collected and dissolved up to 2 mL in PBS buffer which was equivalent to 7.5 % (w/v) honey solution. Total protein was measured using a colorimetric assay kit (Bio-Rad, Mississauga, ON, Canada) according to the manufacturers instructions. Briefly, 5 L of sample or bovine serum albumin (BSA) standards were mixed with 25 L of alkaline copper tartrate solution and 200 L of diluted Folin reagent in a 96-well plate. The color developed by the reduction of Folin reagent by the copper-treated protein was measured at 750 nm. The total protein concentration was expressed as mg /100 g honey by using the BSA calibration curve.
2.4.2. Free amino acids
Honey samples were diluted to 5 % (w/v) solution with water. L-Norvaline was spiked in samples as an IS for recovery of amino acids after the derivatization. Diluted honey samples were filtered through a 0.22 m syringe filter before derivatization. A mixed solution containing 20 proteinogenic amino acids and L-norvaline (IS) was prepared by dissolving the amino acids in 0.1 M hydrogen chloride (final concentration was each at 200 M). Further dilutions were made for generating standard curves for amino acid quantification. Samples and standards were treated with the AccQTag Ultra Derivatization Kit (Waters Limited, Mississauga, ON, Canada) according to the product manual.
Derivatized samples and standards were analyzed by an Agilent 1260 series HPLC system consisting of an autosampler, a degasser, a quaternary pump, a thermostatted column compartment and a DAD. Amino acids were separated on a Phenomenex Kinetex XB-C18 column (100 4.6 mm, 2.6 m) (Phenomenex Inc., Torrance, CA, USA). A binary mobile phase consisting of 0.2 % formic acid in water (v/v, solvent A) and 95 % methanol mixed with 5 % acetonitrile (v/v, solvent B) was used. The solvent gradient was 08 min, 06 % B; 812 min, 6 % B; 1224 min, 636% B; 2426 min, 3642% B, 2628 min, 4244 %, and 2829 min, 44100% B. An extra 9 min of a post-run was added to allow for column restoration. The flow rate was 0.7 mL/min and peaks were monitored at 360 nm. Quantification of amino acids was performed using linear curves (R2 > 0.999) generated from standards with predefined concentrations between 0.5 and 200 M. The recoveries were 99.0% to 103.7% as determined using the IS, L-norvaline. The limit of detection (LOD) and limit of quantification (LOQ) of individual amino acids ranged from 0.17 to 0.71 and 0.57 to 2.35 g/g honey, respectively. Data analysis was conducted using Agilent Chem-Station software.
2.4.3. Hydrolyzed amino acids
Honey samples were diluted to 10 % (w/v) solution with distilled water. L-Norvaline was spiked in samples as an IS for evaluating the recovery efficiency of amino acids after the derivatization. The samples were further diluted by the same volume of 12 M HCl in glass tubes. The oxygen in tubes was removed by nitrogen flushing for 1 min in order to avoid oxidation during the heat treatment. A FisherbrandTM heating block (Fisher Chemicals, Ottawa, ON, Canada) was set at 110C and the samples were heated for 24 h. Samples were neutralized with 6 M sodium hydroxide and were finally adjusted to 2.5% (w/v) solution with distilled water, filtered through a 0.22 m syringe filter before derivatization and HPLC analysis following the same aforementioned protocols for the free amino acids.
2.5. Identification of L-norvaline by LC-MS/MS
The same LC-MS system as described in Section 2.3 was used. Separation of L-norvaline in honey samples was done on an InfinityLab Poroshell 120 HILIC-Z column (2.1 100 mm, 2.7 m, Agilent Technologies, Santa Clara, California, USA). The binary mobile phase consisted of solvent A (10 mM ammonium formate in 100% H2O) and solvent B (10 mM ammonium formate in 90% acetonitrile / 10% H2O). The solvent gradient was: 05 min, 100% to 80% B; 56 min, 80% to 70% B; 67 min, 70% to 50% B; 7 - 9 min, 50% to 20% B; 910 min, 20% B; 1010.5 min, 20% to 100% B; 10.517 min, 100% B. The column temperature was set at 25C, the flow rate was set at 0.3 mL/min, and the injection volume was 2 L. The positive mode was used for ionization and the spray voltage was set at 4.5 kV. Mass spectrometry data were collected using a parallel reaction monitoring (PRM) method with nominal collision energy (NCE) set at 20. Data were visualized and analyzed using Thermo FreeStyle 1.7PS2 software.
2.6. Mineral contents
The minerals of calcium, iron, magnesium, phosphorus, potassium, sodium, and zinc in honey samples (50 g) were analyzed by SGS Crop Science Canada (Guelph, ON, Canada) according to the AOAC 965.09 - atomic absorption spectrophotometric method.
2.7. Vitamins
Honey samples were diluted to 5% (w/v) solution by distilled water before subject to analysis of vitamin C and B2, B3, B5 and B6. The solution was filtered through a 0.22 m filter before analysis. LC-MS/MS analysis was performed using the same instrumentation as stated above. A Kinetex 2.6 F5 100A column (150 4.6 mm, Phenomenex Inc., Torrance, CA, USA) was used. The binary mobile phase consisted of solvent A (99.9% H2O / 0.1% formic acid) and solvent B (99.9% AcN / 0.1% formic acid). The solvent gradient was: 08 min, 3% B; 813 min, 3% to 100% B; 1317 min, 100% B; 1718 min, 100% to 3% B; 1824 min, 3% B. The column temperature was set at 23C, the flow rate was set at 0.3 mL/min, and the injection volume was 5 L. The positive ionization mode was used with spray voltage set at 3.75 kV. Mass spectrometry data were collected using either Full-MS/DDMS2 method (TopN = 10, NCE =30) for qualitative study, or PRM method (NCE = 30) for quantification. Data were visualized and analyzed using Thermo FreeStyle 1.7PS2 and Xcalibur software.
2.7. Organic acids
2.7.1. Analysis of organic acids by LC-MS
Honey samples were diluted to 1% (w/v) solution by distilled water. The solution was filtered through a 0.22 m filter to remove any insoluble materials. The same LC-MS system as described in Section 2.3 was used. Separation was done on a Phenomenex RezexTM ROA-Organic Acid H+ (8 %) column (150 4.6 mm, Phenomenex Inc., Torrance, CA, USA). The mobile phase was 0.5 % formic acid in water and the flow rate was set at 0.3 mL/min. The column temperature was set at 55C and the injection volume was 0.5 L. Mass spectrometry data were collected using Full MS method in negative ionization mode. The spray voltage was set at 4.0 kV. Data were visualized using Thermo FreeStyle 1.7PS2 software. Quantification of citric acid, formic acid, gluconic acid, glutaric acid, glycolic acid, lactic acid, maleic acid, malic acid, malonic acid, oxalic acid, succinic acid was achieved using standard curves generated from individual compounds in serial dilutions (0.0520 mg/L; r2 > 0.980).
2.7.2. Analysis of organic acids by GC
Honey samples were diluted to 2.5% (w/v) solution by 1 M formic acid and were spiked with the IS 2-ethylbutyric acid dissolved in 100% ethanol (final concentration was each at 100 M). Samples were placed at room temperature for 2 h and vortexed vigorously for 15 s every 30 min. The samples were filtered into 2 mL GC vials using 0.2 m nylon filters. The GC analysis was carried out using Agilent 6890A equipped with autosampler and FID detector. Acetic acid and propionic acid were analyzed using a Supelco Nukol fused-silica capillary column (30m 0.25mm 0.25m). The oven temperature was programmed as follows: held at 70C for 1 min, ramped at 7.5C /min to 140C and held for 3 min, and then ramped at 10C /min to 200C and held for 1 min. The inlet was set at 200C and 1 L of sample was injected at 5:1 splitting ratio. The FID detector temperatures were set at 250C with gas flow rates as follows: 30 mL/min H2, 350 mL/min Air, and 26.3 mL/min Makeup flow (N2). The flow rate of He2 carrier gas was 1.7 mL/min. Calibration curves were made in the range of 0.78200 M for both acetic and propionic acid. The LOD for acetic acid and propionic acid was 0.120 mg/100g and 0.296 mg/100 g honey, respectively.
2.7.3. Analysis of oxalic acid by colorimetric assay kit
Honey samples were diluted to 10% (w/v) solution by distilled water. The solution was filtered through a 0.22 m filter to remove any insoluble materials. Oxalic acid was measured using a colorimetric assay kit (Abcam, Waltham, MA, USA) according to the manufacturers instructions. Briefly, 25 L of sample was mixed with the assay buffer up to 50 L in wells of a 96-well plate. Two L of oxalate converter was added to wells of each sample, oxalate standard, and blank (assay buffer). The conversion was done in 1 h at 37C, then 50 L of reaction mix (oxalate enzyme mix and probe) was added to each well. The color was developed at 37C in 1 h with protection from light and was measured at 450 nm. The oxalic acid in honey sample was expressed as mg /100 g honey by using the oxalate calibration curve.
2.7.4. Analysis of formic acid by colorimetric assay kit
Honey samples were diluted to 30% (w/v) solution by distilled water. The solution was filtered through a 0.22 m filter to remove any insoluble materials. Formic acid was measured using a colorimetric assay kit (Neogen Megazyme, Lansing, MI, USA) according to the manufacturers instructions. Briefly, 10 L of sample or formate standard was mixed with 200 L of distilled water in wells of a 96-well plate, then 20 L of assay buffer and NAD+ were added to each sample, formate standard, and blank (distilled water) well. The reaction was initiated by adding 5 L of formate dehydrogenase (FDH) at 25C and lasted for 30 min. The absorbance change due to the production of NADH was measured at 340 nm before and after FDH reaction. The formic acid in honey sample was expressed as mg /100 g honey by calculation from the standard curve of formate.
2.8. Enzyme activity
2.8.1. Amylase activity assay
Honey samples were diluted to 30% (w/v) solution by distilled water. The solution was filtered through a 0.22 m filter to remove any insoluble materials. Amylase activities were measured using a colorimetric assay kit (Abcam, Waltham, MA, USA) according to the manufacturers instructions. Briefly, 50 L of diluted honey samples or nitrophenol standard (020 nmol/well) was mixed with 100 L of amylase reaction mix (ethylidene-pNP-G7 and -glucosidase) in wells of a 96-well plate. Absorbance was measured immediately at 405 nm in a kinetic mode for 60 min at 25C in dark. -Amylase in honey cleaves the substrate ethylidene-pNP-G7 to produce smaller fragments that are eventually modified by -glucosidase, causing the release of a chromophore that can be measured at 405 nm. The amylase activity was expressed as U/100 g honey by using the nitrophenol calibration curve. One U was defined as the amount of amylase that cleaves ethylidene-pNP-G7 to generate 1.0 mol of nitrophenol per min at pH 7.2 at 25C.
2.8.2. Diastase activity assay
Honey samples were diluted to 1% (w/v) solution by 0.1 M acetate buffer (pH = 5.2). The solution was filtered through a 0.22 m filter to remove any insoluble materials. Diastase activities were measured using a colorimetric assay kit (Phadebas, Cambridge, MA, USA) according to the manufacturers instructions. Briefly, 5.0 mL of diluted honey samples or 0.1M acetate buffer used as a blank control were mixed with one Phadebas tablet at 40C for 30 min. The Phadebas tablet contained 45 mg of water-insoluble, cross-linked starch polymer carrying blue dye, which upon hydrolysis by diastase can generate a blue water-soluble product. The reaction was stopped by adding 1 mL of 0.5M sodium hydroxide solution. The absorbance of the supernatant after centrifugation at 1500 g for 5 min was measured in 1 cm cuvette at 620 nm. The diastase activity was expressed as diastase number (DN) according to the formula provided by the manufacturer based on the difference of absorption at 620 nm between the sample and the blank.
2.8.3. Glucose oxidase activity assay
Honey samples were diluted to 30% (w/v) solution by distilled water. The solution was filtered through a 0.22 m filter to remove any insoluble materials. Glucose oxidase activities were measured using a colorimetric assay kit (Abcam, Waltham, MA, USA) according to the manufacturers instructions. Briefly, 50 L of diluted honey samples or glucose oxidase standard was mixed with 50 L of glucose oxidase reaction mix (glucose, AbRed indicator, and horseradish peroxidase) in wells of a 96-well plate. Absorbance was measured immediately at 570 nm in a kinetic mode for 30 min at 37C. Glucose oxidase in samples catalyzed the oxidation of -D-glucose into hydrogen peroxide and D-glucono-1,5-lactone. The produced hydrogen peroxide reacted with AbRed indicator when catalyzed by horseradish peroxidase to generate the compound which can be measured at 570 nm. The glucose oxidase activity was expressed as U /100 g honey by using the calibration curve. One U was defined as amount of glucose oxidase that reacts with 1.0 mol of glucose per min at 37C.
2.8.4. Catalase activity assay
Honey samples were diluted to 3% (w/v) solution by distilled water. The solution was filtered through a 0.22 m filter to remove any insoluble materials. Catalase activities were measured using a colorimetric assay kit (Cayman Chemical, Ann Arbor, MI, USA) according to the manufacturers instructions. Briefly, 20 L of diluted honey samples or formaldehyde standard was mixed with 100 L of assay buffer, 30 L of methanol, and 20 L of 35.3 mM hydrogen peroxide in wells of a 96-well plate. Catalase in samples catalyzes the peroxidation of methanol to produce formaldehyde after 20 min incubation at room temperature. The formaldehyde was measured calorimetrically at 540 nm with 4-amino-3-hydrazino-5-mercapto-1,2,4-triazole (purpald) and potassium periodate. The catalase activity was expressed as U/100 g honey by using the formaldehyde calibration curve. One U was defined as the amount of catalase that oxidizes methanol to generate 1.0 mol of formaldehyde per min at room temperature.
2.8.5. Invertase activity assay
Honey samples were diluted to 30% (w/v) solution by distilled water. The solution was filtered through a 0.22 m filter to remove any insoluble materials. Glucose in honey was removed by centrifuging at 5,000 g using an Amicon ultra centrifugal filter device with a molecular weight cut-off of 10,000 Da (Merck KGaA, Darmstadt, Germany) for at least seven times. The concentrated protein was collected and dissolved up to 500 L in PBS buffer. Invertase activities were measured using a colorimetric assay kit (Abcam, Waltham, MA, USA) according to the manufacturers instructions. Briefly, 25 L of concentrated protein solution was mixed with 15 L of assay buffer and 10 L of sucrose (i.e. invertase substrate) in microplate wells. The same volume of sample without adding sucrose was prepared simultaneously as a background control. Invertase in honey catalyzes the hydrolysis of sucrose by cleaving its glycosidic bond to form glucose and fructose. After 20 min of reaction, samples, background controls, and sucrose standards were mixed with provided enzyme mix and probe to generate a chromogen that can be measured at 570 nm. The absorption of background control was subtracted from the sample in order to eliminate the influence of residual glucose in a sample. The invertase activity was expressed as mU/100 g honey by using the glucose calibration curve. One mU was defined as the amount of invertase that cleaves sucrose to generate 1.0 mmol of glucose per min at 37C.
2.8.6. Acid phosphatase activity assay
Honey samples were diluted to 30% (w/v) solution by distilled water. The solution was filtered through a 0.22 m filter to remove any insoluble materials. Acid phosphatase activities were measured using a colorimetric assay kit (Abcam, Waltham, MA, USA) according to the manufacturers instructions. Briefly, 20 L of diluted honey samples were mixed with 60 L of assay buffer in wells of a 96-well plate. Standard dilutions were prepared by mixing p-nitrophenyl phosphate (pNPP) and the assay buffer up to 120 L to obtain the final concentrations of 020 nmol/well. Reaction was initiated by adding 50 L of pNPP in samples and 10 L of acid phosphatase in standards simultaneously. The same volume of sample was mixed with 50 L of pNPP and 20 L of stop solution as a background control. Acid phosphatase converts pNPP substrate to an equal amount of colored p-nitrophenol (pNP). The reaction was stopped by adding 20 L of stop solution after incubation for 60 min at 25C in dark. The produced pNP was measured at 405 nm. The absorption of background control was subtracted from the sample in order to eliminate the influence of the natural color in the sample. The acid phosphatase activity was expressed as mg P/100 g honey/24 h by using the pNPP calibration curve.
2.9. Total phenolic content (TPC)
TPC in honey was determined by the Folin-Ciocalteu method as described previously with slight modifications (Li et al., 2012). Briefly, honey samples were diluted to 30 % (w/v) solution by distilled water. Twenty-five L of diluted sample or standard was mixed with 125 L 0.2 M Folin-Ciocalteu reagent in wells of a 96-well microplate and allowed to react for 10 min at room temperature. Then 125 L 7.5% (w/v) Na2CO3 was added and incubated for 60 min at room temperature. The absorbance was measured at 765 nm using a UV-visible microplate kinetic reader (EL 340, Bio-Tek Instruments, Inc., Winooski, VT, USA). TPC was expressed as g gallic acid equivalents per g honey (g GAE/g honey) by using the gallic acid calibration curve.
2.10. Sugar analysis
Common and rare sugars of honey were analyzed using high performance anion exchange chromatography with pulsed amperometric detection (HPAEC-PAD, Dionex ICS-5000, Thermo-Fisher, USA). in conjunction with Dionex CarboPac PA1 analytical (250 mm 4 mm) and guard ( 4 mm 50 mm) columns. Glucose, fructose and sucrose were eluted at 25C with 10 mM NaOH for 15 min, followed by 100 mM NaOH for 30 min at a flow rate of 1 mL/min. Separation of maltose, isomaltose, turanose, palatinose and nigerose was done under the same conditions as above-stated, except elution with 100 mM NaOH was 45 min. Honey samples were diluted in deionized water and filtered through a 0.45 m nylon filter prior to injection. Quantification of all sugars was achieved by using calibration curves of standards. Concentrations were expressed as g/100 g honey. The moisture percentage was calculated using a digital refractometer with a pea sized honey sample (5 g) while taking temperature into account.
The total sugars were measured using the phenol-sulfuric acid method. Quantification was done using serial dilutions of glucose/fructose standards at concentrations ranging from 00.1 mg/mL. Standard or honey samples (0.1 mg/mL, 0.5 mL) were transferred into separate test tubes, to which phenol solution (5% in water, 0.5 mL) and sulfuric acid concentrate (2.5 mL) were added. The test tubes were vortexed and then cooled in a water bath for 15 min. Samples were transferred to cuvettes and the absorbance was measured at 490 nm using a spectrophotometer. Total sugar concentration of the honey samples was calculated using the standard curve generated from the standards and expressed as g/100 g.
Ash (mineral content) was measured according to the methods of (AOAC, 1999). Five g of honey was placed in a combustion pot, which was preheated to darkness with a gas flame to prevent honey foaming. Then, the darkened samples were incinerated at high temperature (400C) in a burning muffle for 5 h (overnight). After cooling to room temperature, the obtained ash was weighed. Percentage of ash was determined by dividing the weight of the ash content by the original weight of the honey sample.
The colour of honey samples was measured using Pfund classifier. Homogenous honey samples devoid of air bubbles were transferred into a cuvette with a 10 mm light path until the cuvette was approximately half full. Deionized water was used as a blank. The cuvette was then placed in a spectrophotometer (GENESYS 50 UV-Visible Spectrophotometer, Thermo Fisher Scientific, ), and the absorbance of the samples was measured at 560 nm. Measurements were performed in triplicate for each sample. The Pfund value (in mm) was a result of the mean absorbance value multiplied by the Pfund factor 3.15, and the colour was determined using the approved colour standards of the United States Department of Agriculture (USDA, 1985).
2.11. Statistical analysis
All honey samples were extracted and analyzed in triplicates, and the results were expressed as mean standard deviation. A one-way analysis of variance (ANOVA) followed by Tukeys Honest Significant Difference (HSD) test was performed using SigmaPlot 15.0 (Palo Alto, CA, USA) to analyze the difference of mean values of phenolics, free/hydrolyzed amino acids, TPC, and total protein in honeys of different botanical origins. Significant differences were considered at p < 0.05. Principal component analyses (PCA) were performed using original concentration units to gain an overview of the relationships between individual phenolics and free amino acids in various honeys. The PCA analysis was performed and visualized using biplot generated by R Studio Software (Boston, MA, USA). All raw data are tabulated in Table S2a-l.
| 3. Results and discussion | Top |
3.1. Characterization of phenolic compounds in honey varieties
TPC in honeys ranged from 3791269 g GAE/g, with buckwheat honey having the highest and significantly higher content than the rest of the honeys in the study (Table 1) .
 Click to view |
Table 1. Total phenolic and protein contents of honeys |
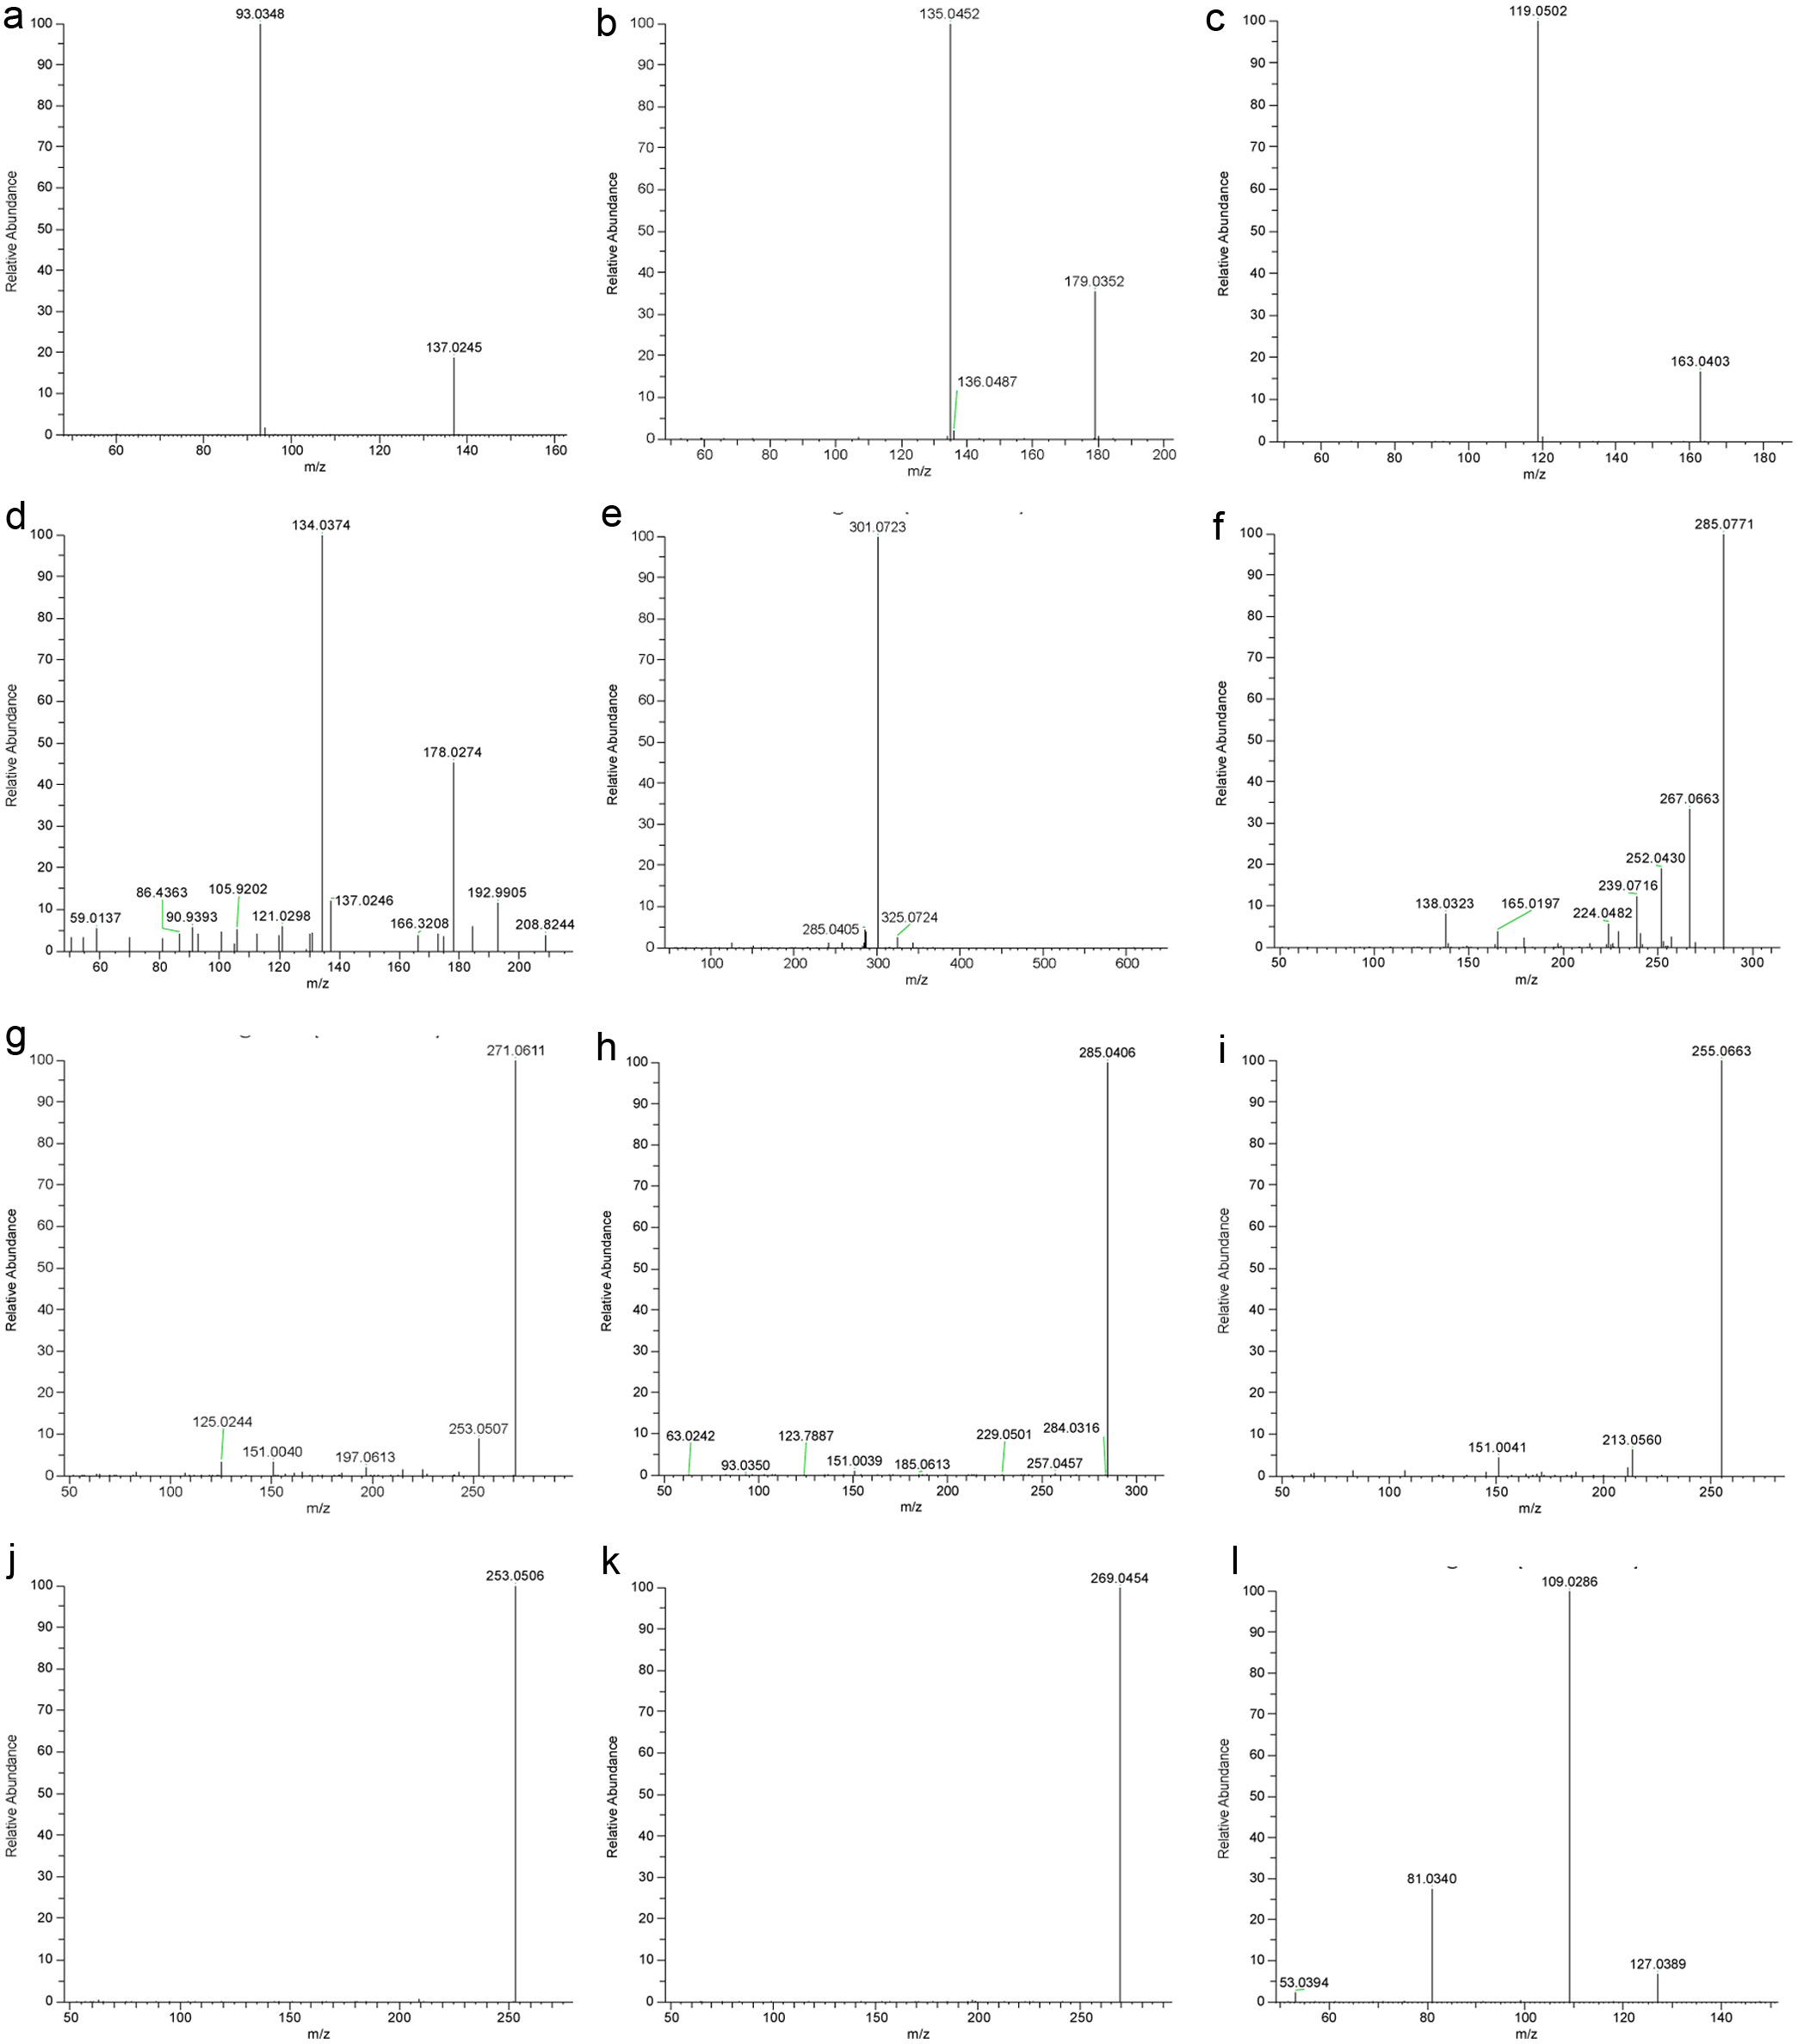
A total of 29 phenolic compounds including phenolic acids, flavonoids, and flavonoid glycosides were identified based on congruent retention time, UVmax, exact mass of molecular ion [M-H]- and major fragment ions with the standards, and quantified by LC-MS/MS (Tables 2 and 3, Figure 1). Pinobanksin (1.012 - 7.481 g/g), pinocembrin (0.985 - 7.514 g/g), chrysin (0.229 - 2.159 g/g) and galangin (0.194 - 2.005 g/g) were the main phenolic compounds in all honeys. These are categorized as propolis-derived flavonoids since they are abundant in bud exudates of poplars which are collected by bees to produce propolis (Ferreres et al., 1996). P5ME was originally detected in propolis (Greenaway et al., 1990) but rarely reported in honey (Toms-Barbern et al., 2001). Our present work identified the P5ME based on its [M-H]- at m/z 285.0768 and the major fragment ions of [M-H-H2O]- at m/z 267.0663 and [M-H-H2O-CH3]- at m/z 252.0430, which was later confirmed with the authentic P5ME standard. Our study presents the first quantitative data of P5ME in honey (0.337 to 2.497 g/g) (Table 3). Most nectar-derived flavonoids were detected in all floral and multifloral honeys, but the concentrations varied significantly. Clover honey possessed the greatest amount of kaempferol (4.784 0.801 g/g), quercetin (0.929 0.170 g/g), isorhamnetin (0.765 0.100 g/g), and naringenin (0.111 0.079 g/g), whereas alfalfa honey had the highest level of apigenin (0.876 0.340 g/g). Compared with flavonoids, phenolic acids were more honey-specific. For instance, caffeic acid and isoferulic acid were identified as the dominant phenolic acids in alfalfa honey. P-Hydroxybenzoic acid and p-coumaric acid, on the other hand, were uniquely abundant in buckwheat honey. These honey-specific phenolic acids and some unique flavonoids, such as hesperidin and hesperetin, are discussed below.
Click to view |
Table 2. Identification of phenolic compounds, abscisic acid, furfural, and 5-HMF in honey by LC-MS |
Click to view |
Table 3. Quantification of phenolic compounds, abscisic acid, furfural, and 5-HMF in honey by LC-MS |
 Click for large image |
Figure 1. MS/MS spectra of selected phenolic compounds and 5-HMF. (a) p-Hydroxybenzoic acid; (b) Caffeic acid; (c) p-Coumaric acid; (d) Isoferulic acid; (e) Hesperidin; (f) Pinobanksin-5-methyl ether; (g) Pinobanksin; (h) Kaempferol; (i) Pinocembrin; (j) Chrysin; (k) Galangin; (l) 5-HMF. |
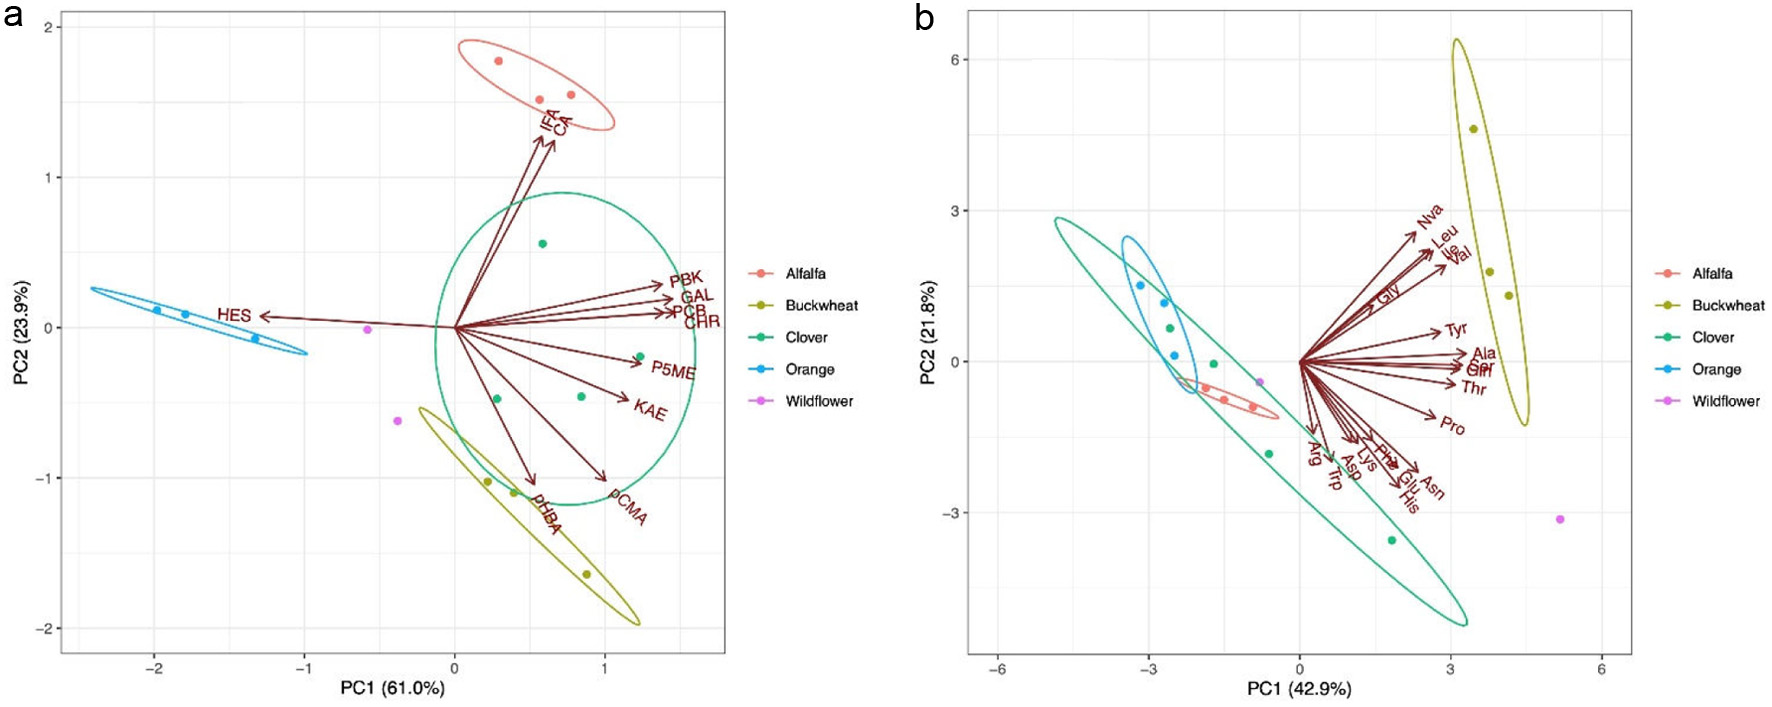
The PCA results of the main phenolic compounds (>2 g/g) in the studied honey samples are shown in Figure 2A. Since the first two components (61.0 % and 23.9 %) accounted for most of the variance in the observations, the score plot was used to assess the observations for their clusters, outliers, and trends. The loading plot (Figure 2A) showed that flavonoids greatly influenced the first principal component, whereas phenolic acids mainly contributed to the second one. The correlations among pinobanksin, pinocembrin, chrysin, galangin and P5ME ranged from 0.738 to 0.994 (Table S3). Although the flavonoid profile can be helpful in differentiating adulterated honey from natural honey, the presence of these five flavonoids in all studied honey samples make them unsuitable candidates as molecular markers to distinguish specific botanical origin (Mao, Schuler, and Berenbaum (2013). Interestingly, hesperidin was in an opposite direction of all other flavonoids in the loading plot, suggesting a very unique compound in honey samples. By grouping these observations by honey variety, it was clear that three orange honey samples loaded the most positive direction of the vector of hesperidin, which indicated an exclusively high hesperidin level in orange honey. In fact, hesperidin was only quantifiable in orange honey with an average concentration of 1.981 g/g in our study (Table 3). Hesperetin, an aglycone of hesperidin, has been considered a chemical marker for citrus honey (Citrus sp.) because it was found in the nectar of citrus blossoms (Ferreres et al., 1994; Mao et al., 2013). Our results showed that the concentration of hesperidin and hesperetin are in a ratio of 9.1 to 1.0, which is in agreement with a recent report (Maldonado et al., 2021). Based on data obtained in the present study, we believe that hesperidin, a diglycoside of hesperetin, serves as a better chemical marker than hesperetin for orange honey. The second principal component mostly represents phenolic acids, among which the loadings of caffeic acid and isoferulic acid accumulated closely with a correlation of 0.996 (Table S3). These two phenolic acids in alfalfa honey samples were 6.884 0.320 and 3.262 0.228 g/g, respectively, which were at least 3-fold higher than in other honeys (Table 3). The chemical markers of alfalfa honey have not been clearly identified although several works made good attempts (Akbari et al., 2020; Ciappini, 2019). In the present study, isoferulic acid was identified and quantified for the first time in alfalfa honey. p-Hydroxybenzoic acid and p-coumaric acid, with a correlation of 0.858 (Table S3), was plotted in an opposite direction to the caffeic acid and isoferulic acid (Figure 2A). Buckwheat honey loaded the most positive direction of the vectors of p-hydroxybenzoic acid and p-coumaric acid with concentrations of 12.483 4.230 and 4.910 1.224 g/g, respectively (Table 3). These two phenolic acids have been reported for buckwheat honey (Jiang et al., 2020; Sergiel et al., 2014; Shen et al., 2019) and shown to be representative compounds for buckwheat honey. Our result confirmed that p-hydroxybenzoic acid and p-coumaric acid can be employed collectively as good chemical markers for buckwheat honey.
 Click for large image |
Figure 2. Principal component analysis biplots of phenolics (a) and free amino acids (b) contents in honey varieties. CA: caffeic acid, CHR: Chrysin, GAL: Galangin, HES: hesperidin, IFA: isoferulic acid, KAE: Kaempferol, pCMA: p-coumaric acid, pHBA: p-hydroxybenzoic acid, P5ME: pinobanksin-5-methyl ether, PBK: Pinobanksin, PCB: Pinocembrin. Ala: alanine, Arg: arginine, Asn: asparagine, Asp: aspartic acid, Cys: cysteine, Gln: glutamine, Glu: glutamic acid, Gly: glycine, His: histidine, Ile: isoleucine, Leu: leucine, Lys: lysine, Met: methionine, Nva: norvaline, Phe: phenylalanine, Pro: proline, Ser: serine, Thr: threonine, Trp: tryptophan, Tyr: tyrosine, Val: valine. |
3.2. Characterization of 5-HMF, furfural, and abscisic acid in honey varieties
5-HMF, furfural, and abscisic acid are three major non-phenolic compounds detected in each of tested honey samples. The concentrations were 4.13110.059, 0.8588.124, and 0.8497.634 g/g , respectively. 5-HMF is a dehydration product of reducing sugars such as glucose and fructose mostly via Maillard reaction, and has been found in honey and many food. Even though minor negative health effects have been reported for 5-HMF, it also contributes to many health benefits including antioxidant, anti-allergic, and anti-hypoxic effects (Chen et al., 2014; Suri and Chhabra, 2020). Although the safe level is not well clarified, the maximum limit of 5-HMF was established at 40 mg/kg honey in order to avoid extensive thermal processing (WHO, 1981). Furfural, produced by dehydration of pentose such as xylose, was also quantified in all honey samples. Except for the buckwheat honey which had a similar level of furfural to 5-HMF, furfural concentrations in all other honeys were significantly lower compared with 5-HMF (Table 3). Since both 5-HMF and furfural in honey are mainly produced during thermal processing and long storage, they are therefore not suitable for serving as chemical markers of the honeys botanical source.
Abscisic acid could be used as a botanical marker because of its differentiable contents in floral nectars. It has been reported as a marker of heather honey based on its high concentration of 418 g/g (Toms-Barbern et al., 2001). Our data showed a high concentration of abscisic acid in orange honey (7.634 2.400 g/g), which is 5.69.0 folds of that of other honeys (Table 3). Abscisic acid could be used as a secondary marker in combination with other primary chemical markers for discriminating between honeys of different botanic origins.
3.3. Total protein content and characterization of amino acids profiles in honey varieties
The total protein contents of different honeys were between 38088831 g/g, with buckwheat honey having significantly higher concentration (ca. 2-fold) than the rest four honey varieties (Table 1). The intrinsic free amino acids and those produced by hydrolysis of the protein fraction of different honeys were also analyzed and the results are presented in Table 4.
Click to view |
Table 4. Intrinsic free amino acid and hydrolyzed amino acid concentrations in honey by HPLC |
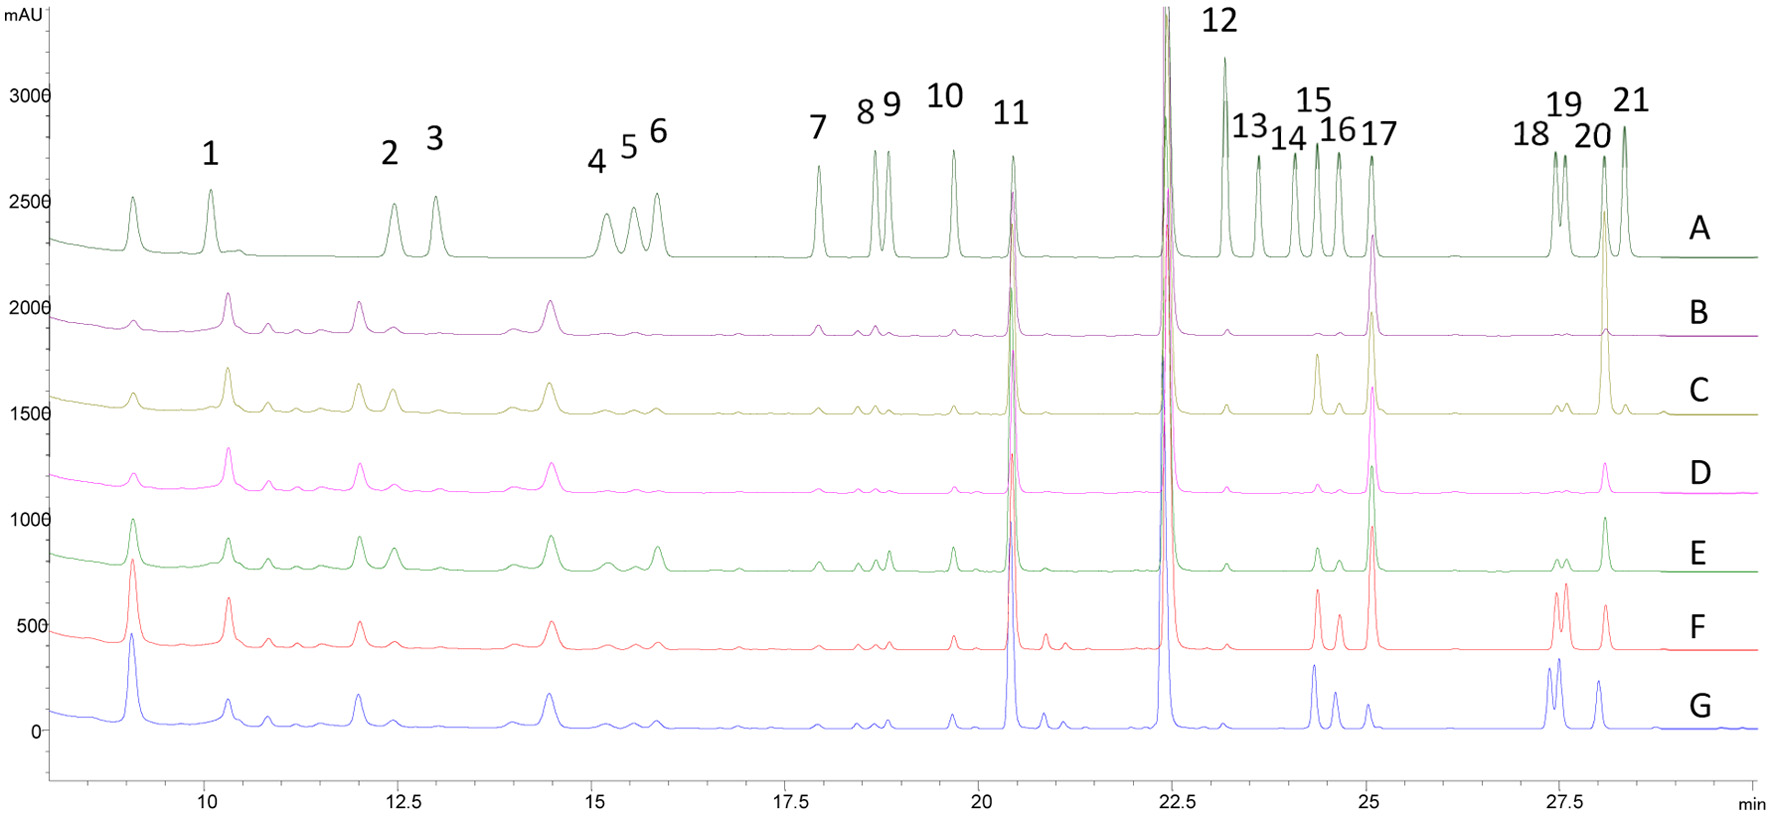
The HPLC chromatograms of derivatized amino acids in a standard mix and different honey varieties are shown in Figure 3. All 21 L-amino acids including the IS were well baseline separated. Total free amino acids (sum of all quantified amino acids) ranged from 549.8 72.7 to 1421.9 53.5 g/g for all honeys. Proline was the prevalent amino acid in all honey samples, ranging from 286.9 33.6 g/g in orange honey to 547.1 162.4 g/g in wildflower honey (Table 4). Proline in honey mostly originates from both nectar and hemolymph of honeybees (ozowicka et al., 2021). A significant decrease in proline concentration in honey was reported when honeybee was fed with sucrose rather than pollens (Nisbet et al., 2018). The prevalence and the pollen origin make proline an important criterion for detecting honey adulteration (Dimins et al., 2022). Buckwheat honey contained the highest total free amino acid content, and total branched-chain amino acids (BCAA), including leucine, isoleucine and valine. The total BCAA in buckwheat honey was 276.6 g/g, which was 6.7 to 16.5 folds of the BCAA concentrations found in other floral honeys (Table 4). Our result was highly comparable with the BCAA contents in buckwheat honey collected in Latvia (Dimins et al., 2022). BCAA are essential amino acids and must be obtained from the diet. Their major health benefits, both acting as materials to build muscle tissues and to increase protein synthesis through the activation of mTOR signaling pathway, have been widely reported and understood (Zhang et al., 2017b). The high content of BCAA could make buckwheat honey a natural supplement of these essential nutrients. Phenylalanine is the most abundant essential amino acid in all studied honeys, at 252.7, 152.0, 147.1, 60.8, and 32.2 g/g in clover, wildflower, buckwheat, orange, and alfalfa honey, respectively (Table 4). In addition to being a precursor of tyrosine, a recent study showed that phenylalanine may increase brain-derived neurotrophic factor in honey-treated rats and reduce the depressive-like behavior (Mustafa et al., 2019). As a conditionally essential amino acid, tyrosine was quantifiable mostly in buckwheat honey, followed by clover and wildflower honeys (Table 4).
 Click for large image |
Figure 3. HPLC chromatograms of amino acid standards (A) and free amino acids with spiked internal standard of L-norvaline in honey varieties of alfalfa (B), clover (C), orange (D), wildflower (E), and buckwheat (F), as well as buckwheat honey without internal standard of norvaline (G). The HPLC peaks represent L-amino acid of histidine (1), asparagine (2), arginine (3), serine (4), glycine (5), glutamine (6), aspartic acid (7), glutamic acid (8), threonine (9), alanine (10), proline (11), lysine (12), cysteine (13), methionine (14), tyrosine (15), valine (16), norvaline (17), isoleucine (18), leucine (19), phenylalanine (20), and tryptophan (21). |
The total amino acid contents after acid hydrolysis were generally 23 folds higher than the total free amino acids (Table 4). Again, buckwheat honey had the highest total concentration at 4,628.11 g/g which was significantly higher than the rest of the honeys. This can be explained by its significantly higher total protein content compared to other honeys (Table 1). It is worth noting that asparagine, glutamine and tryptophan are known to be prone to acid hydrolysis (Mustatea et al., 2019), therefore they were not detected in samples subjected to this method (Table 4).
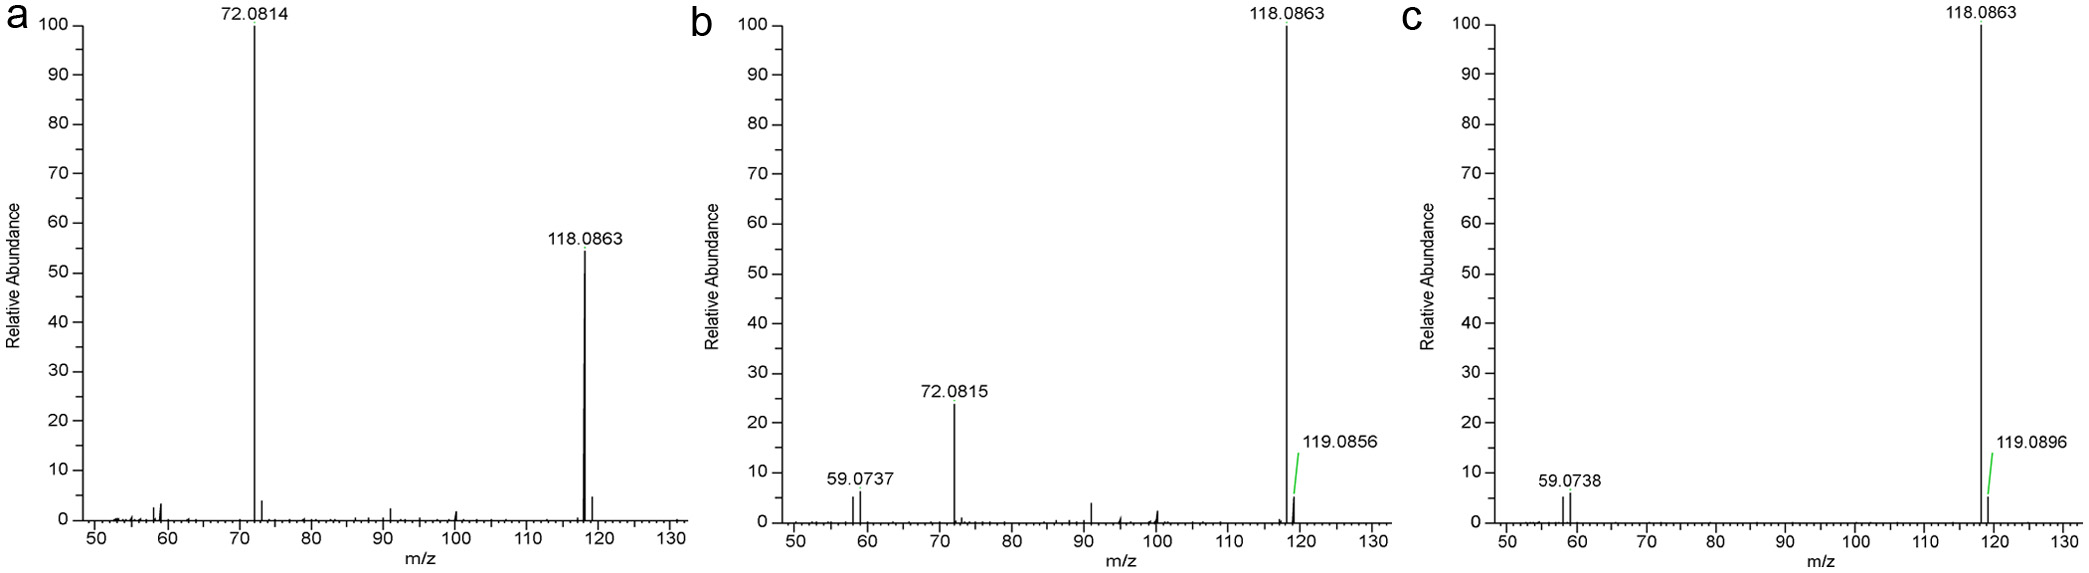
L-Norvaline has never before been reported for honey, and it was serendipitously found only in buckwheat honey of the present study when the spiked L-norvaline, serving as IS, showed abnormally higher concentration than its actual amount. The buckwheat honey samples were reanalyzed without spiked L-norvaline and its intrinsic L-norvaline was identified by MS/MS based on its matching [M+H]+ at m/z 118.0864 and the major fragment ion of [M-COOH+H]+ at m/z 72.0815 with the L-norvaline standard. It should be noted that the relative intensity of the ion at m/z 118 in buckwheat honey sample was lower than that of L-norvaline standard (tR = 4.9 min) (Figure 4A, 4B). The extra m/z 118 ions are present due to an abundant unknown compound eluted earlier (tR = 4.5 min) than L-norvaline, which produces a high background at m/z 118 (Figure 4C). L-Norvaline averaged 39.0 g/g, which was the ninth most abundant among all 21 free amino acids in buckwheat honey, and it seems to be all in free form as the concentration was similar to that after the hydrolysis (Table 4). To the best of the authors knowledge, the present finding is the first report of naturally occurring L-norvaline in buckwheat honey. Given its exclusive existence in the buckwheat honey, L-norvaline could mostly be originating from buckwheat flower, although further work on the amino acid profiling of buckwheat flower should be performed. As a potential inhibitor of arginase, L-norvaline raises the endogenous stock of L-arginine and consequently promotes the activity of nitric oxide synthase (NOS) which utilizes L-arginine as a substrate and produces nitric oxide. In contrast, substrate deficiency of NOS results in the production of superoxide anion rather than nitric oxide, which leads to the development of endothelial dysfunction due to the lack of nitric oxide. (Gilinsky et al., 2020; Pokrovskiy et al., 2011). This suggests the potential higher health benefits of buckwheat honey.
 Click for large image |
Figure 4. MS/MS spectra of diluted buckwheat honey samples (a), L-norvaline standard (b) and an unknown compound eluted earlier than L-norvaline but contributing a background at m/z 118.0864 (c). |
The contents of free amino acids were subjected to PCA to seek insights on the relationship between the amino acid composition and the honey varieties. We did not perform PCA analysis of amino acids resulted from acid hydrolysis because of the instability of certain amino acids and that in general all other amino acid concentrations followed similar trend as those for the intrinsic free amino acids. As shown in Figure 2B, the first two principal components explain about 64.70% of the total variance in all observations, thus were used to create the visualized biplot. The loading plot showed a cluster of vectors representing isoleucine, leucine, valine, tyrosine, and norvaline, resulting from their high correlation values between 0.717 and 0.995 (Table S4). By grouping the observations by honey variety, three buckwheat honey samples loaded the most positive direction of the vectors, which indicates that the BCAA, tyrosine, and norvaline level are most strongly correlated with buckwheat honey. While amino acids isoleucine, leucine, and tyrosine have been suggested as chemical markers for buckwheat honey (Dimins et al., 2022), the present study strongly points to L-norvaline, an non-proteinogenic amino acid, as a more appropriate marker or identifier for buckwheat honey.
3.4. Organic acid, vitamin and mineral compositions and enzymatic activities of honeys
The organic acid and mineral contents of selected honeys are shown in Table 5. A total of 7 minerals, i.e., calcium, iron, magnesium, phosphorus, potassium, sodium and zinc were detected and quantified. No statistical analysis was performed for the mineral contents due to their relatively insignificant amounts in the honey.
Click to view |
Table 5. Concentrations of organic acids, minerals, vitamins and enzyme activities in honeys |
Organic acids are metabolites from oxidation of sugars during aerobic and/anaerobic fermentation of honey. They not only contribute to the organoleptic and physicochemical properties, but also act as antimicrobial and antioxidant agents, and have been used as indicators of honey freshness (ee and Cinkmanis, 2019). The predominant organic acid was gluconic acid in all honey samples, ranging from 2,574.58 to 6,430.92 g/g (Table 5), which is in agreement with existing reports. Gluconic acid formation is known to be catalyzed by glucose oxidase from honeybees (ee and Cinkmanis, 2019) whose activity was also detected in the present study along with other enzymes (Table 5). This oxidation reaction also produces hydrogen peroxide, which is responsible for the antimicrobial activities; but the extra hydrogen peroxide is reduced by catalase to water and oxygen. Catalase activity was detected in all honey samples (Table 5). Hydrolytic enzymes such as amylase, diastase, and invertase are secreted by honeybees for converting oligo- and polysaccharides to monosaccharides; for example, diastase converts nectar polysaccharides (amylose) to glucose, and invertase converts the sucrose into fructose and glucose (Alaerjani et al., 2022). Acid phosphatase is also a hydrolytic enzyme but it catalyzes the production of inorganic phosphate from organic phosphate. Enzymatic activities of different honeys are listed in Table 5. Enzyme activities of honey have been used as markers of honey quality and botanic origin (Alaerjani et al., 2022). Among the vitamins, only B vitamins were detected and quantified, and buckwheat honey had significantly higher concentrations than other honey samples (Table 5).
3.5. Major and rare sugars
Table 6 shows the concentrations of individual and total sugars and the moisture contents of the honey samples. Total sugar content ranged from 78.53 g/100 g to 81.87 g/100 g with predominant sugars being the monosaccharides, fructose and glucose, which is in line with other reports (da Silva et al., 2016). Rare sugars in the honey samples included turanose, isomaltulose, nigerose and kojibiose among others sugars (de la Fuente et al., 2011; Doner, 1977; Escuredo et al., 2013). While we only measured some key rare disaccharides and trisaccharides, more than 25 of such have been reported (de la Fuente et al., 2011; Doner, 1977; Escuredo et al., 2013), comprising 515% of honey sugars. Our results show a similar amount of rare sugars when we subtract major sugars from total sugars measured using the phenol-sulfuric acid method. Rare sugars have individually shown to have metabolic benefits with majority being non-cariogenic (Ooshima et al., 1983) and exerting prebiotic (Chung et al., 2017; Hodoniczky et al., 2012; Sanz et al., 2005), anti-glycemic (Lee et al., 2016), anti-inflammatory (Chung et al., 2017), and immune modulation (Mirosaki et al., 1999) effects in animal models. These rare sugars have also been found to reduce blood glucose, body weight (Ahmed et al., 2022), and acute metabolic hormones related to obesity like GIP and GLP-1 activities in human studies (Keyhani-Nejad et al., 2015), thus explaining some metabolic benefits of honey (Ahmed et al., 2023).
Click to view |
Table 6. Concentrations of individual carbohydrates and sugar contents of honeys |
| 4. Conclusions | Top |
The present study characterized the composition of major bioactive components and nutrients of typical honeys available in North America. Qualitative and quantitative data of phenolic compounds, protein and amino acids, organic acids, minerals, vitamins, and other minor components, including abscisic acid and furans were collected. A total of 29 phenolic compounds, mostly phenolic acids and flavonoids were identified and quantified. P5ME, along with pinobanksin, pinocembrin, chrysin and galangin, were found commonly and abundantly in all tested honeys. The propolis origin of P5ME could help to differentiate a genuine honey from an adulterated one. The profile of nectar-derived phenolic compounds displayed significant differences among different honey varieties. Results of the present study not only confirmed the use of previously reported chemical markers (e.g. p-hydroxybenzoic acid and p-coumaric acid for buckwheat honey, and hesperidin for orange honey), but also showed the potential use of caffeic acid and isoferulic acid as markers for alfalfa honey. Conversely, unlike the phenolic compounds, the free amino acid profiles of the studied honeys showed less diversity in all but buckwheat honey. The buckwheat honey possessed significantly higher levels of BCAA than other honeys, and contained L-norvaline exclusively. The serendipitous new finding of L-norvaline in buckwheat honey not only adds a new marker for identifying its botanic origin, but the unique bioactivity of L-norvaline may also confer additional health-promoting properties for buckwheat honey. It should be noted that the composition of floral honey may be affected by several factors including geographical origin, seasonal changes, processing, and storage conditions; therefore, single components, such as phenolics, alone may not be sufficient markers for identifying the botanical origin of honeys. Our results suggest that combining markers of different chemical categories, such as phenolics and amino acids, and other phytochemicals (e.g., abscisic acid) could enhance the confidence in discriminating origins between different floral honeys. The current study also provides important baseline data for all major bioactive components of honeys, and thus, will contribute significantly to the identification of honey components for various health benefits. Moreover, our study showed that in addition to major sugars (glucose and fructose), the studied honeys were also sources of minor and rare sugars, which may further contribute to the different bioactivities of honey. Future work will focus on the uniquely identified phenolic compounds, free amino acids, and rare sugars or their combinations for their contribution to potential health benefits.
| Supplementary material | Top |
Table S1. Sample information of tested honeys.
Table S2. (a) Raw data of the concentrations of individual phenolic compounds detected in different honey samples; (b) Raw data of the concentrations of individual amino acids detected in different honey samples; (c) Raw data of the concentrations of individual organic acids detected in different honey samples; (d) Raw data of the concentrations of minerals detected in different honey samples; (e) Raw data of the total phenolic contents (TPC) of different honey samples; (f) Raw data of the total protein contents of different honey samples; (g) Raw data of the enzyme activities of different honey samples; (h) Raw data of sugar concentrations of different honey samples; (i) Raw data of total carbohydrate concentrations of different honey samples; (j) Raw data of moisture contents of different honey samples; (k) Raw data of USDA color (Pfund Scale, mm) of different honey samples; (l) Raw data of ash contents of different honey samples.
Table S3. Correlation matrix of phenolics in honey samples.
Table S4. Correlation matrix of free amino acids in honey samples.
Acknowledgments
AcknowledgmentsWe thank the National Honey Board of the United States of America and Glycemia Consulting Inc. (Toronto, Ontario, Canada) for providing honey samples and financial support. This is Project #J-002712 of Agriculture & Agri-Food Canada.
| References | Top |